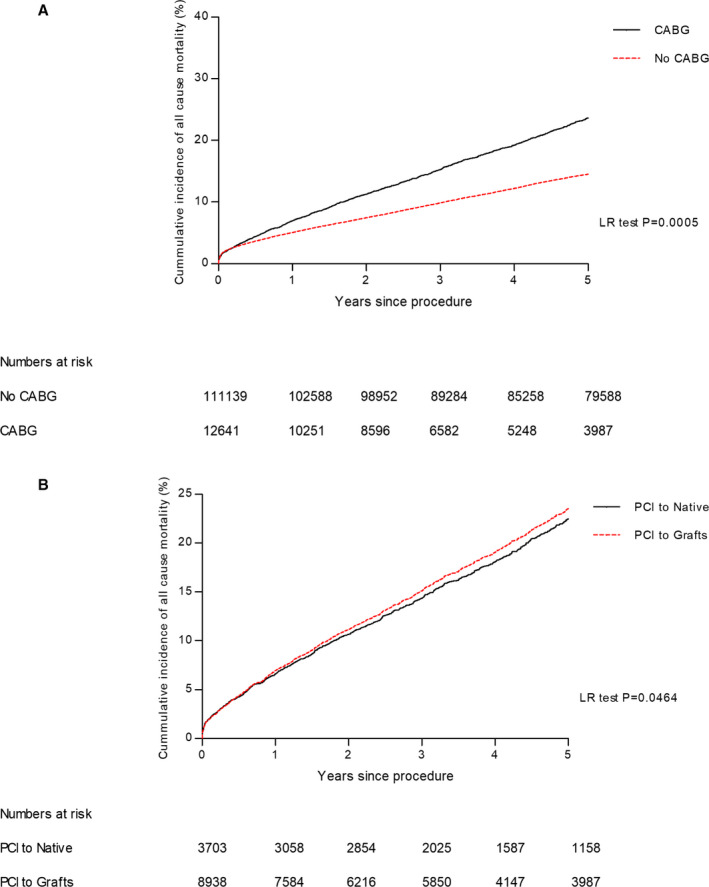
Figure 1. Kaplan‐Meier curves showing cumulative probability of all‐cause mortality after PCI according to group: (A) PCI in patients who have had CABG vs no CABG and (B) PCI to native vs grafts.

CABG indicates coronary artery bypass grafting; LR, Log Rank; and PCI, percutaneous coronary intervention.
