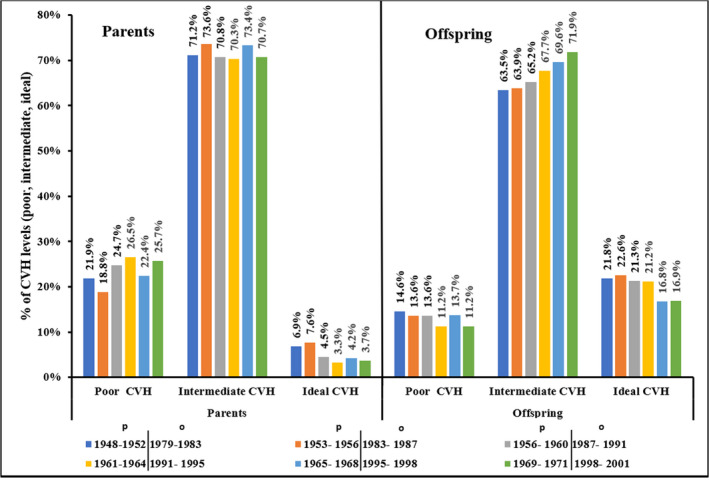
Figure 1. Prevalence and trends of cardiovascular health ("poor", "intermediate", "ideal") for parents and offspring at each paired exam.

Each bar color coding represents the exam‐cycle year period for both parents and offspring. P trend <0.05 for percent change of parent/offspring ideal cardiovascular health and offspring intermediate cardiovascular health. CVH indicates cardiovascular health.
