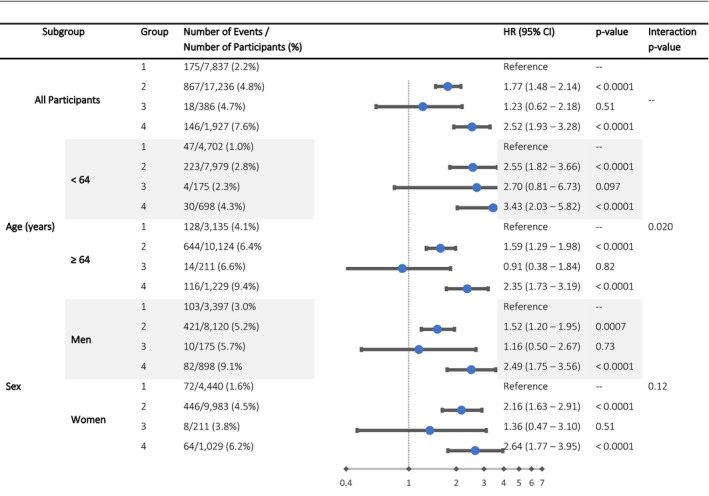
Figure 2. Hazard ratios (HRs) for stroke in subgroups.

Interaction analysis in prespecified subgroups demonstrates consistency in the reported relationships overall, although group assignment (reflecting the presence or absence of atrial fibrillation and the presence or absence of comorbidities) appears to explain more of the risk of stroke among participants younger than the median. Model is adjusted for age, sex, race, education, income, geographic region, high‐density lipoprotein cholesterol, total cholesterol, body mass index (BMI), smoking, regular aspirin use, and warfarin use.
