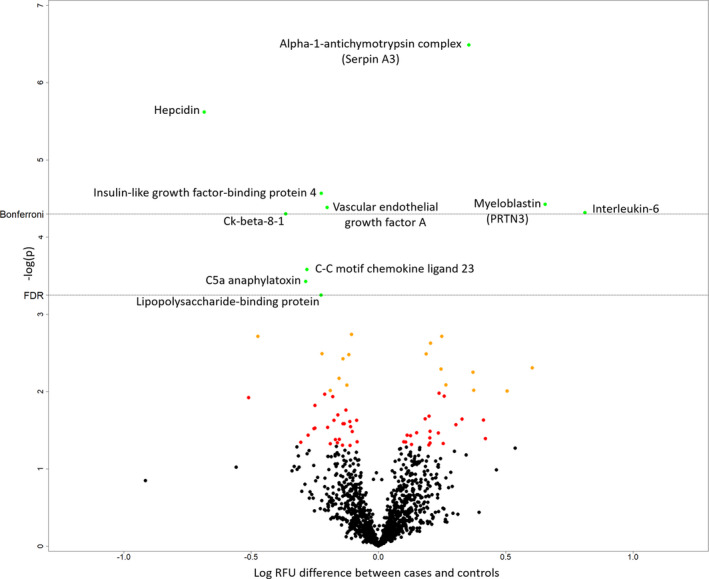
Figure 1. Difference in relative abundance of the 1074 SOMAscan proteins between the placebo and tocilizumab groups. Shown on the.

x axis is the log‐relative fluorescence unit (RFU) difference between groups, and on the y axis is the −log P value. Named proteins (in green) are those surpassing the false discovery rate (FDR) of 0.1 (Benjamini‐Hochberg). The Bonferroni threshold is also shown. The slow off‐rate aptamer name is used. Soluble interleukin 6 (IL‐6) receptor is beyond the axis used (P=2.3×10⁻²⁰). C5A indicates complement component 5a anaphylatoxin; IGFBP4, insulin‐like growth factor‐binding protein 4; LBP, lipopolysaccharide‐binding protein; PRTN3, proteinase 3; SerpinA3, serpin family A member 3; and VEGFA, vascular endothelial growth factor A.
