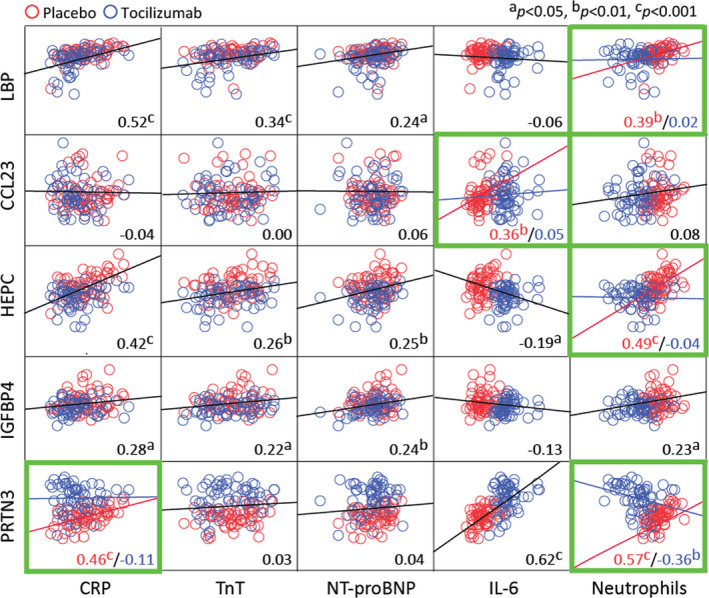
Figure 3. Associations between newly identified proteins modulated by tocilizumab and parameters measured in the original study.

Dotplots showing associations between area under the curve (log‐transformed) of plasma levels of LBP (lipopolysaccharide‐binding protein), CCL23 (C‐C motif ligand 23), hepcidin, IGFBP4 (insulin‐like growth factor‐binding 4), and PRTN3 (proteinase 3) with CRP (C‐reactive protein), hsTnT (high‐sensitivity troponin T), NT‐proBNP (N‐terminal pro‐B‐type natriuretic peptide), interleukin 6 (IL‐6), and neutrophil counts during hospitalization (baseline to 3 days) in patients with non–ST‐segment–elevation myocardial infarction receiving placebo (red circles, n=59) or tocilizumab (blue circles n=58). Black lines represent the regression line and the numbers in the bottom right the correlation coefficient for the whole group. If an interaction with tocilizumab was detected (green frames, see Statistical Analysis), the regression lines and numbers reflect either placebo (red) or tocilizumab (blue).
