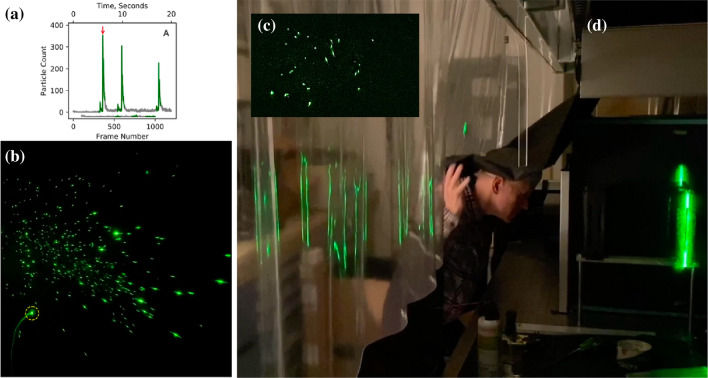
Fig. 15.
Panel A shows the number of flashes that were recorded in a single video frame. Sampling frequency was 60 fps. Green denotes the time when the person spoke. Note that, during the silent intervals (grey line), the number of flashes did not vanish immediately, presumably because a few droplets remained in the light sheet for a few seconds after speaking stopped (Anfinrud et al. 2020). b Shows a photogram corresponding to a peak in droplets emission (see arrow in a). The different brightness of individual flashes indicates the different droplet size (images provided by Adriaan Bax). Panel C shows a snapshot of saliva droplets, and Panel D an image of the experimental setup (photo credit: National Institute of Diabetes and Digestive and Kidney Diseases, National Institutes of Health)

