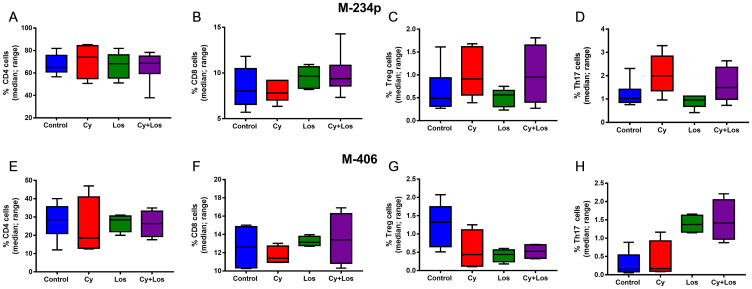
Figure 4. Quantification of circulating T cells by flow cytometry: % of positive cells (median, range).
M-234p: (A) CD4 cells, N. S. (B) CD8 cells, N. S. (C) Treg cells, N. S. (D) Th17 cells, N. S. M-406: (E) CD4 cells, N. S. (F) CD8 cells, N. S. (G) Treg cells, (P = 0.064). (H) Th17 cells: Control vs Cy+Los, (P = 0.0580). Kruskal-Wallis multiple comparison test and Dunn’s post-test.

