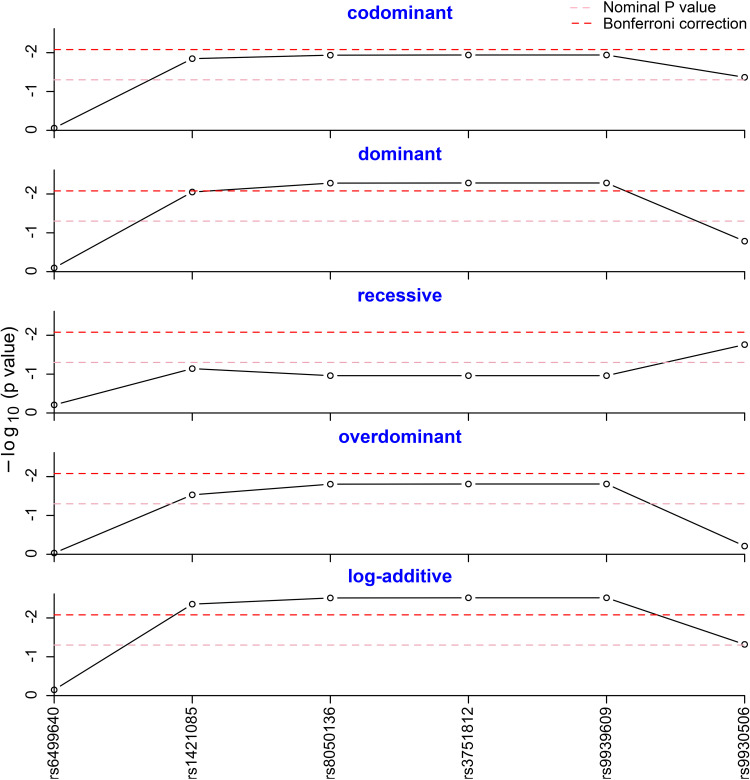
Figure 1.
Genotype frequency analysis in five genetic models. The genotype frequencies of rs8050136, rs3751812 and rs9939609 were statistically different in the dominant model after Bonferroni correction. The genotype frequencies of rs1421085, rs8050136, rs3751812 and rs9939609 were statistically different in the log-additive model after Bonferroni correction.

