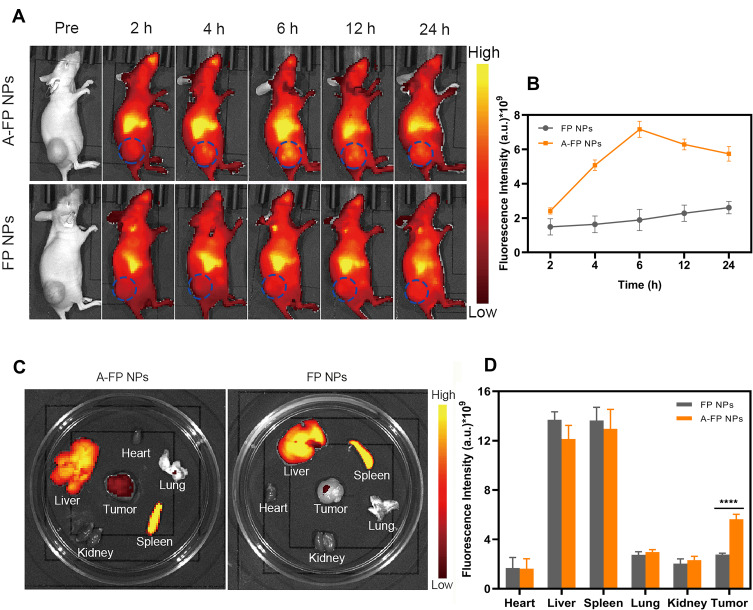
Figure 9.
The biodistribution of NPs. (A) In vivo FL images after the intravenous injection of NPs (DiR-labeled FP NPs, DiR-labeled A-FP NPs) at different time points. (B) Changes of FL signal intensities within tumor regions at corresponding time points. (C) In vitro FL images of the tumors and major organs dissected from mice 24 h after injection of different NPs. (D) Quantitative biodistribution analysis of different NPs in mice of major organs and tumors. (Values are means ± s.d., n = 5, ****P < 0.0001).
Abbreviations: FL, fluorescence; DiR, 1,1ʹ-dioctadecyl-3,3,3ʹ,3ʹtetramethylindotricarbocyanine iodide; A-FP NPs, AS1411-PLGA@FePc@PFP; FP NPs, PLGA@FePc@PFP.

