Figure 10.
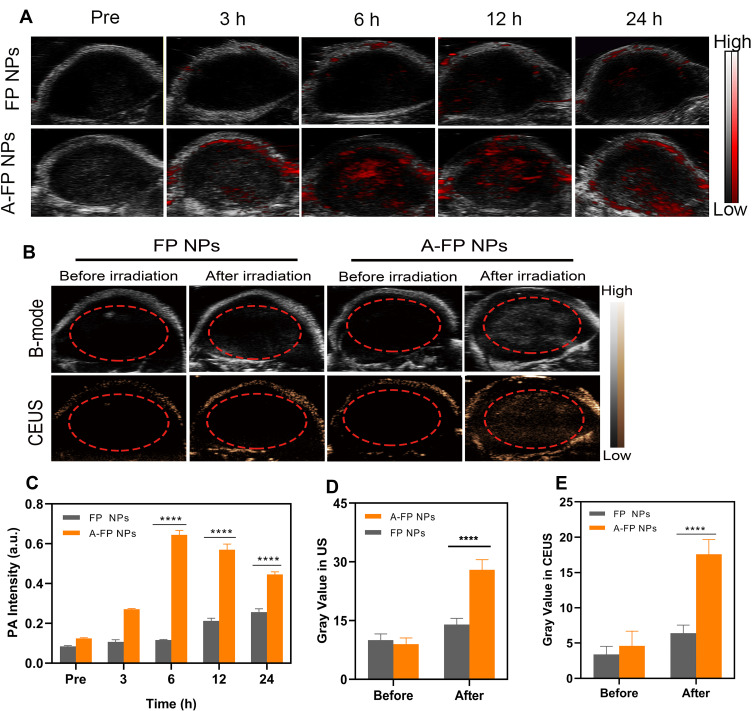
In vivo PA/US imaging. (A) In vivo PA images of tumors in MCF-7 tumor-bearing mice after intravenous injection of different NPs at different time points. (B) US and CEUS images of MCF-7 tumor-bearing mice after intravenous injection with different NPs at 6 h and the whole tumor region irradiation with the 660 nm laser (1.5 W/cm2). (C) Changes of PA-signal intensities within tumor regions at corresponding time points. The gray values in US (D) and CEUS (E) of before and after irradiation. (Values are means ± s.d., n = 5, ****P < 0.0001).
Abbreviations: PA, photoacoustic; US, ultrasound; B-mode, brightness modulation; CEUS, contrast enhanced ultrasound; A-FP NPs, AS1411-PLGA@FePc@PFP; FP NPs, PLGA@FePc@PFP.

