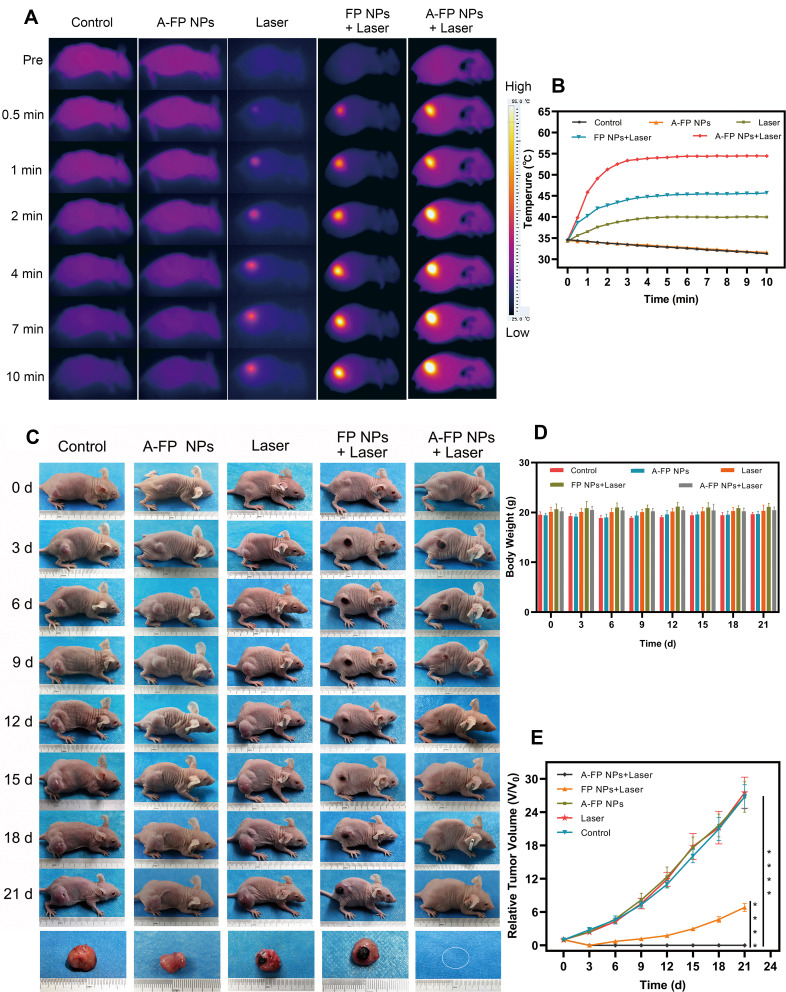
Figure 11.
In vivo PTT treatment. (A) IR thermal images of MCF-7 tumor-bearing mice with various groups (control, A-FP NPs only, laser only, FP NPs combined with the laser, and A-FP NPs combined with the laser). (B) The temperature time curves of tumor sites in different groups by the thermal imager. (C) Photographs of changes in MCF-7 tumor-bearing mice of different groups were recorded by cameras every three days during the 21 days. (D) The body weight curves of MCF-7 tumor-bearing mice with various treatments during the 21 days. (E) Relative tumor growth curves of five groups after various treatments during the observation period. (Values are means ± s.d., n = 5, ****P < 0.0001).
Abbreviations: PTT, photothermal Therapy; A-FP NPs, AS1411-PLGA@FePc@PFP; FP NPs, PLGA@FePc@PFP.

