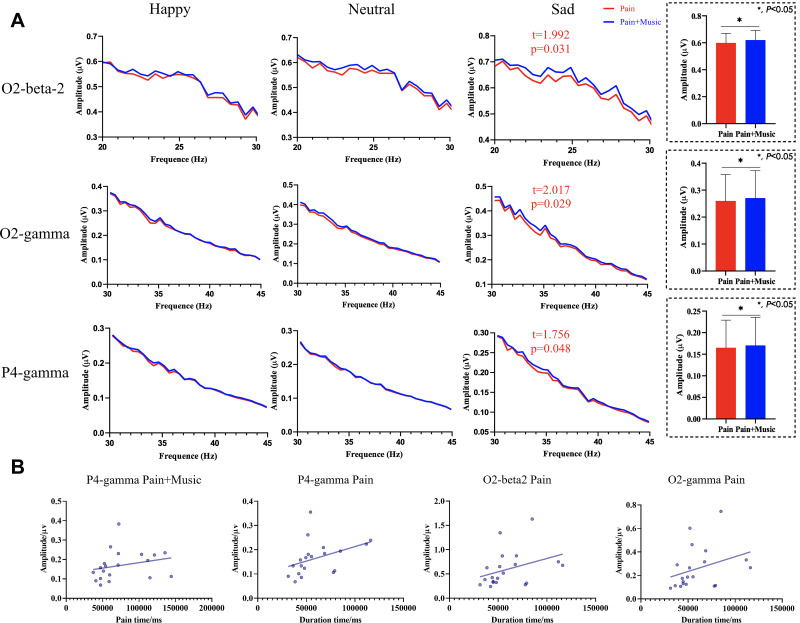
Figure 2.
Spectral differences and correlations between pain tolerance times and FFT amplitudes. (A) The spectral amplitudes at the O2 and P4 electrodes in the beta-2 (20–30 Hz) and gamma (30–45 Hz) bands. Blue and red lines denote the remission group listening to music (Pain+Music) condition and no sound (Pain) condition, respectively. (B) Correlation analysis between the spectra amplitudes and the pain tolerance times. There were positive correlations between the spectra amplitudes and pain tolerance times in the two conditions (remission group listening to sad music, Pain+Sad Music; remission group with no sound, Pain) in the gamma (30–45 Hz) band at the P4 electrode. There were positive correlations between spectra amplitudes and pain tolerance times in the no sound (Pain) condition in the beta-2 (20–30 Hz) and gamma (30–45 Hz) bands at the O2 electrode.

