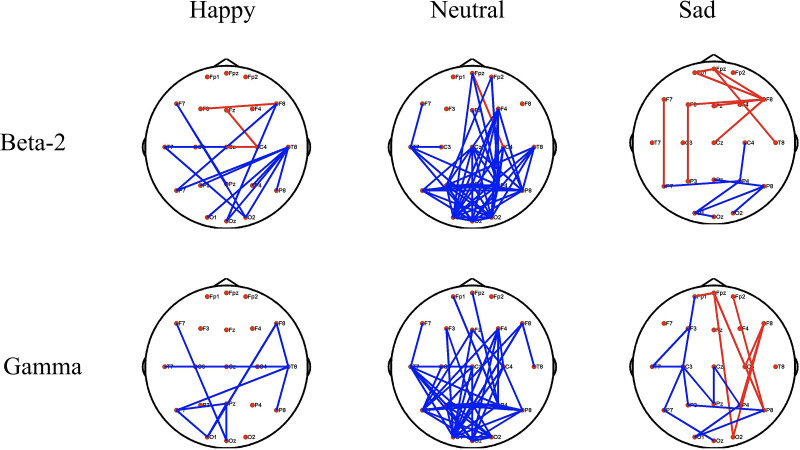
Figure 4.
Topological differences in the beta-2 (20–30 Hz) and gamma (30–45 Hz) bands between the remission group listening to music (Pain+Music) and no sound (Pain) conditions. The red solid lines denote that the functional connectivity of Pain+Music is higher than that of Pain, and the blue solid lines denote that the functional connectivity of Pain+Music is lower than that of Pain (FDR-uncorrected p < 0.05).

