
Figure 2: PET/CT imaging of a rat model of S. aureus Newman-induced triceps infection.
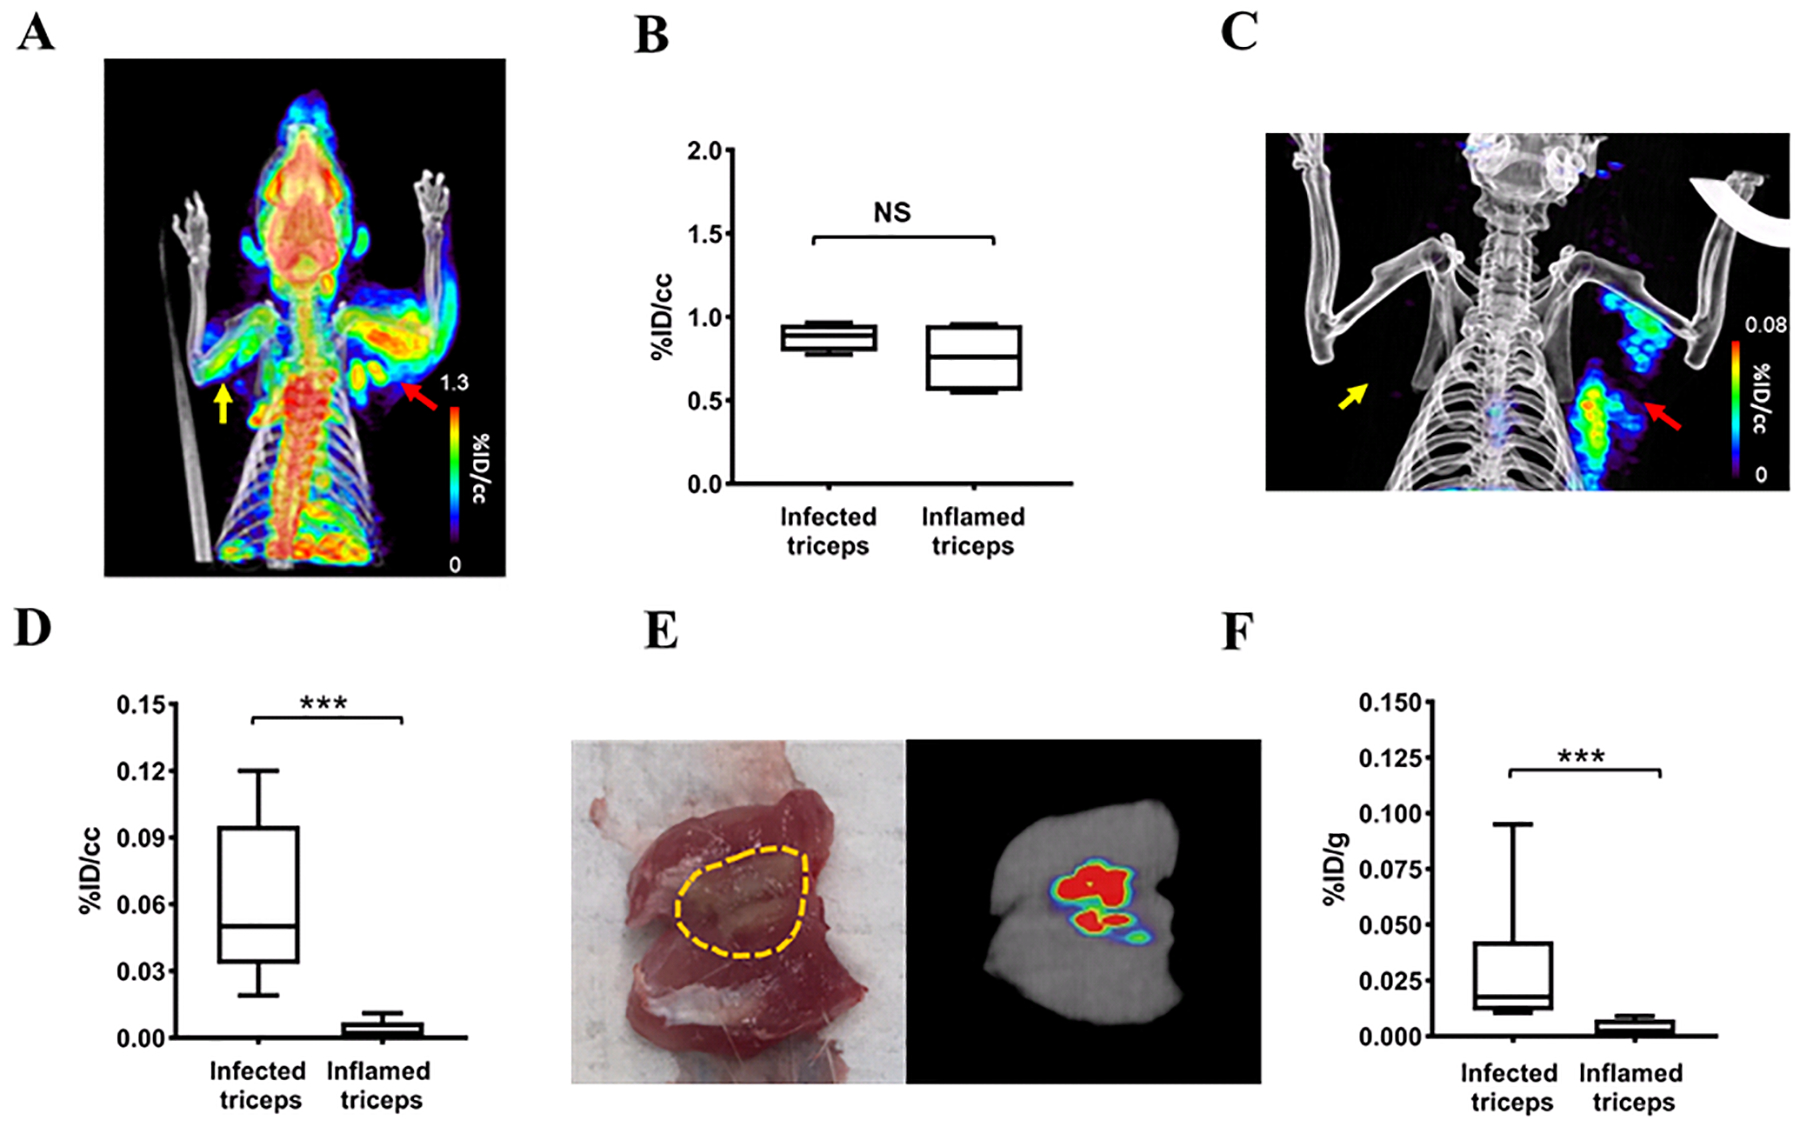
(A) [18F]FDG PET/CT of a rat in which 8.2 ± 0.2 log10 CFU of S. aureus Newman has been injected into the right triceps (red arrow) and with sterile inflammation in the left triceps (yellow arrow). The image was acquired 60–80 min after tracer injection. (B) Comparison of [18F]FDG accumulation 60–80 min post-injection at sites of infection and sterile inflammation, represented as % injected dose per cc (%ID/cc). (C) 2-[18F]F-ENB accumulation was observed in the infected (red arrow) but not inflamed triceps (yellow arrow) 180–200 min after tracer injection. (D) Comparison of 2-[18F]F-ENB accumulation in the infected triceps and inflamed triceps 180–200 min after tracer injection: ***P < 0.001 from a two-tailed Mann-Whitney U Test (n = 7). (E) Ex vivo PET imaging of the excised infected triceps. The area of infection is highlighted in yellow. (F) Post-mortem ex vivo analysis of 2-[18F]F-ENB biodistribution at sites of infection and sterile inflammation 3 h after tracer injection, represented as % injected dose per gram (%ID/g): ***P < 0.001 from a two-tailed Mann-Whitney U Test (n = 8).