
Figure 5.
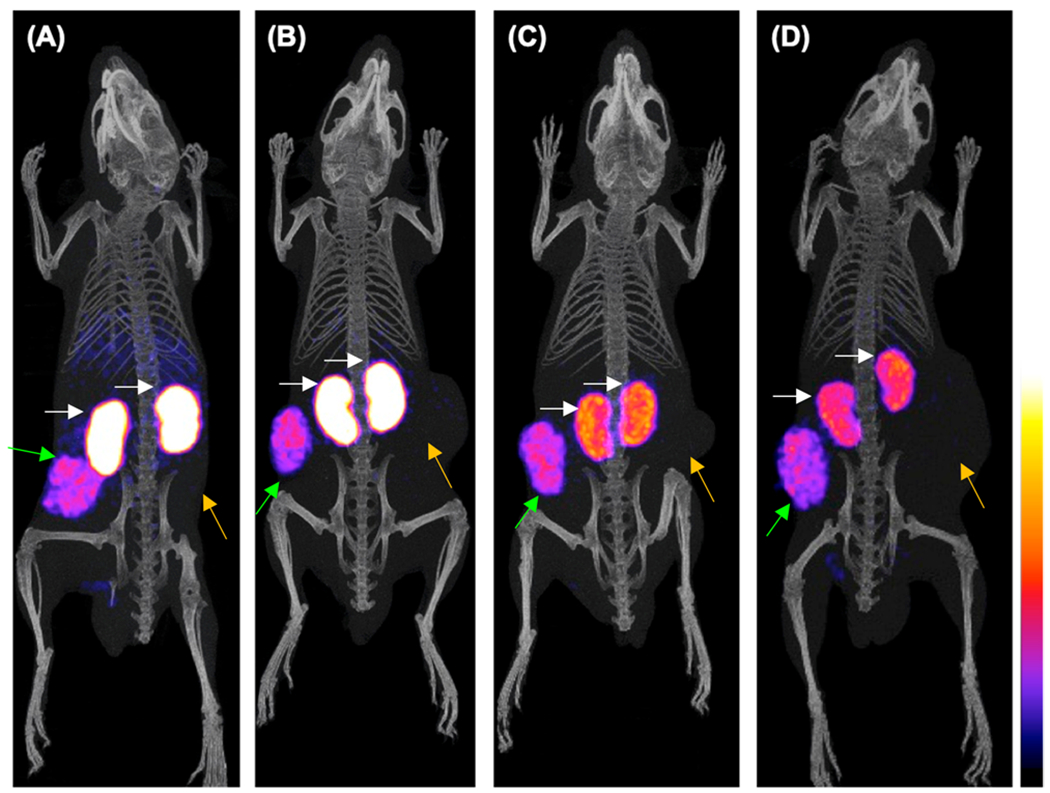
Static whole body SPECT/CT images of mice 4 h after injection of [99mTc]Tc-DGA1 (A,B) alone or (C,D) with gelofusine coinjection; green arrows are showing the radiotracer uptake in the HEK293-CCK2i4svR xenografts, orange arrows are pointing to the HEK293T tumors, and white arrows are indicating the kidneys. Intense uptake is observed in the CCK2i4svR-expressing tumors, but no uptake is evident in the tumors devoid of CCK2i4svR expression; when gelofusine is administered, the renal uptake has been significantly reduced. The color bar indicates the difference in accumulated activity (purple being the lowest and white being the highest level of accumulation).