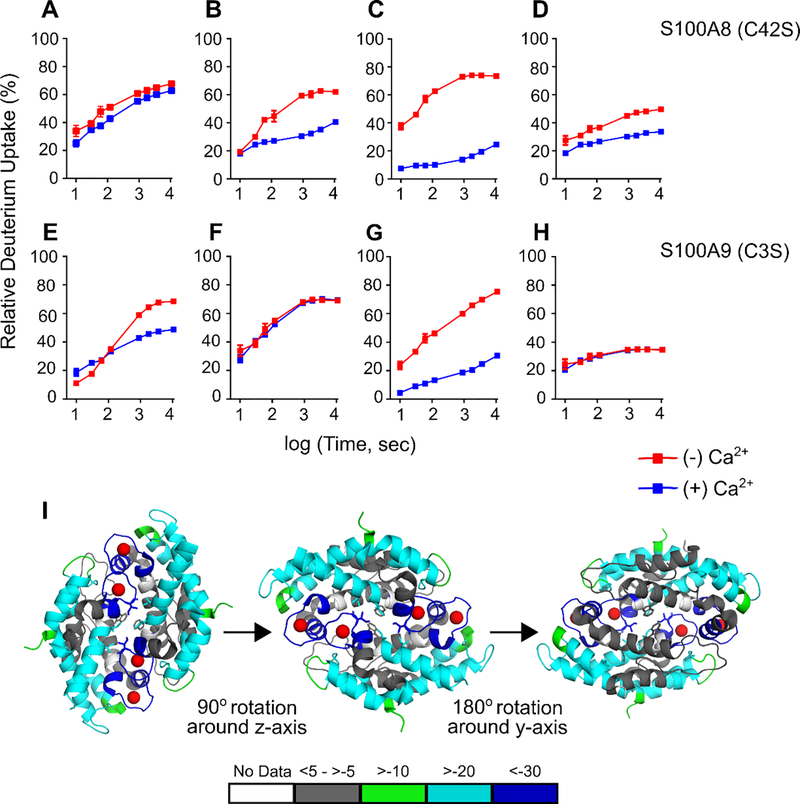
Figure 2.
HDX studies of CP-Ser (5 μM) in the absence and presence of excess Ca2+ ions (250 μM). (A-H) Representative HDX kinetic plots for peptides from the CP-Ser subunits S100A8(C42S) (A-D) and S100A9(C3S) (E-H) in the absence (red) and presence (blue) of Ca2+ ions. Kinetic plots for peptides from EF-hands (A, B, C, E, and G) and other regions (D, F, H) are shown. Peptides sequences and associated charge states are: (A) YHKYSLIKGNF (S100A8(C42S) 16–26 (+2)), (B) HAVYRDDL (S100A8(C42S) 27–34 (+2)), (C) FKELDINTDGAVNF (S100A8(C24S) 55–68 (+2)), (D) VIKMGVAAHKKSHEESHKE (S100A8(C42S) 75–93 (+3)), (E) SVKLGHPDTLNQGEF (S100A9(C3S) 23–37 (+2)), (F) FLKKENKNEKVIE (S100A9 (C3S) 48–60 (+2)), (G) LDTNADKQLSFEE (S100A9(C3S) 66–78 (+2)), and (H) TWASHEKMHEGDEGPGHHHKPGLGEGTP (S100A9(C3S) 87–114 (+3), respectively. (I) Differential HDX uptake in % is mapped onto the crystal structure of the Ca2+-bound CP-Ser tetramer (PDB: 4XJK). Different views of the differential HDX map rotated 90° around z-axis from and 180° around the y-axis from are shown. Colored bars represent averaged HDX differences between apo and holo CP-Ser across all seven time points in duplicate. The extent of HDX is represented by colored regions in the map, gray regions mark no or little change with green, cyan and blue representing small, medium and large changes in deuterium uptake in the holo-state, respectively.

