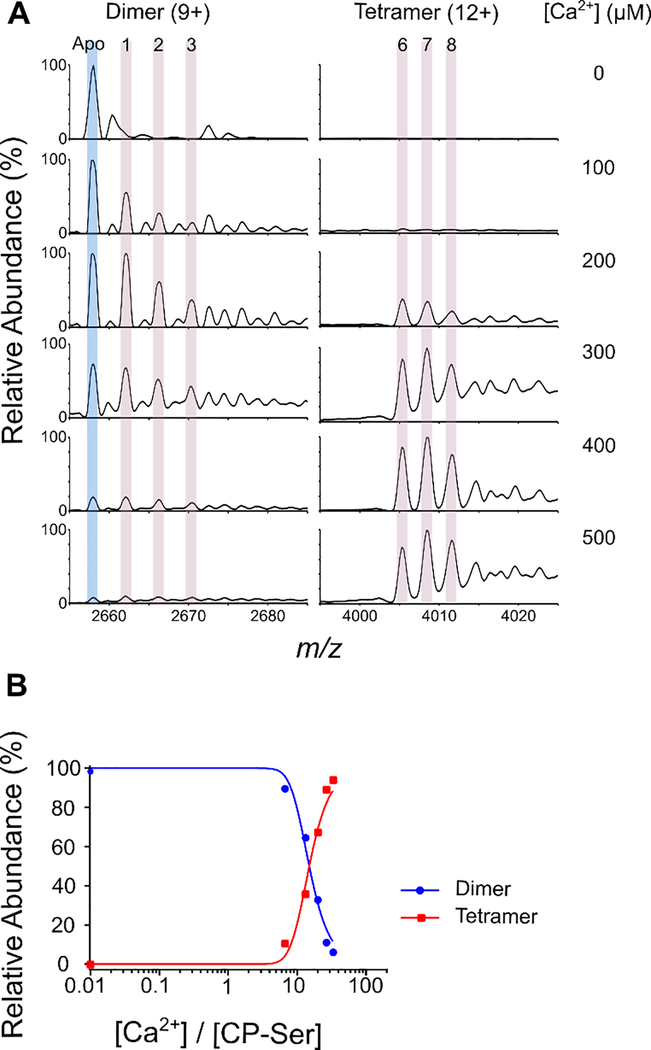
Figure 6.
Native MS of CP-Ser in the absence and presence of Ca2+ ions. (A) Native mass spectra of 15 μM CP-Ser in the presence of 0–500 μM Ca2+ ions, zoomed in to show the most abundant charge states of dimer (9+) and tetramer (12+) species. The apo CP-Ser peak is highlighted in light blue and peaks for Ca2+-bound species are highlighted in pink. (B) Plots of CP-Ser species distribution at different [Ca2+] represented for dimer (blue circles) and tetramer (red squares). Signal intensities for each CP-Ser species are corrected for the fraction of the total dimer subunit for each [Ca2+].

