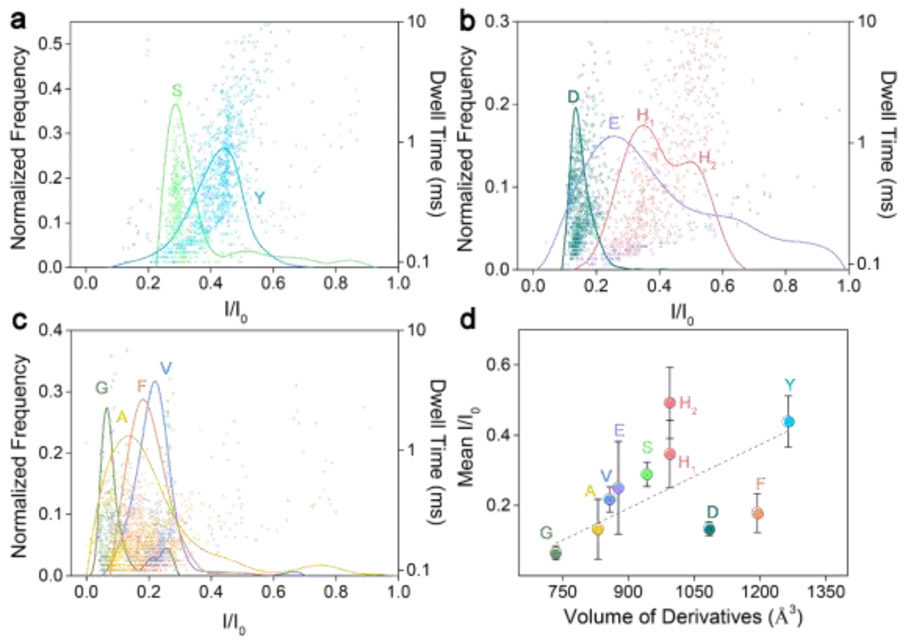
Fig. 3.
Superimposed histograms of I/I0 obtained from nanopore for NITC-modified amino acids, analyzed individually and grouped as: (a) polar, (b) charged, and (c) non-polar amino acids. (d) Mean relative current blockade and standard deviation produced by each NITC amino acid derivative versus its spatial volume. The grey dashed line is obtained by a linear fit of the main peaks (represented by the circle). All data was acquired in 3 M KCl, 10 mM Tris-HCl buffer, at 8.0 pH, 200 μM derivatives concentration, and under a 100-mV bias applied to the trans side. For each histogram, at least 600-1000 events were analyzed.

