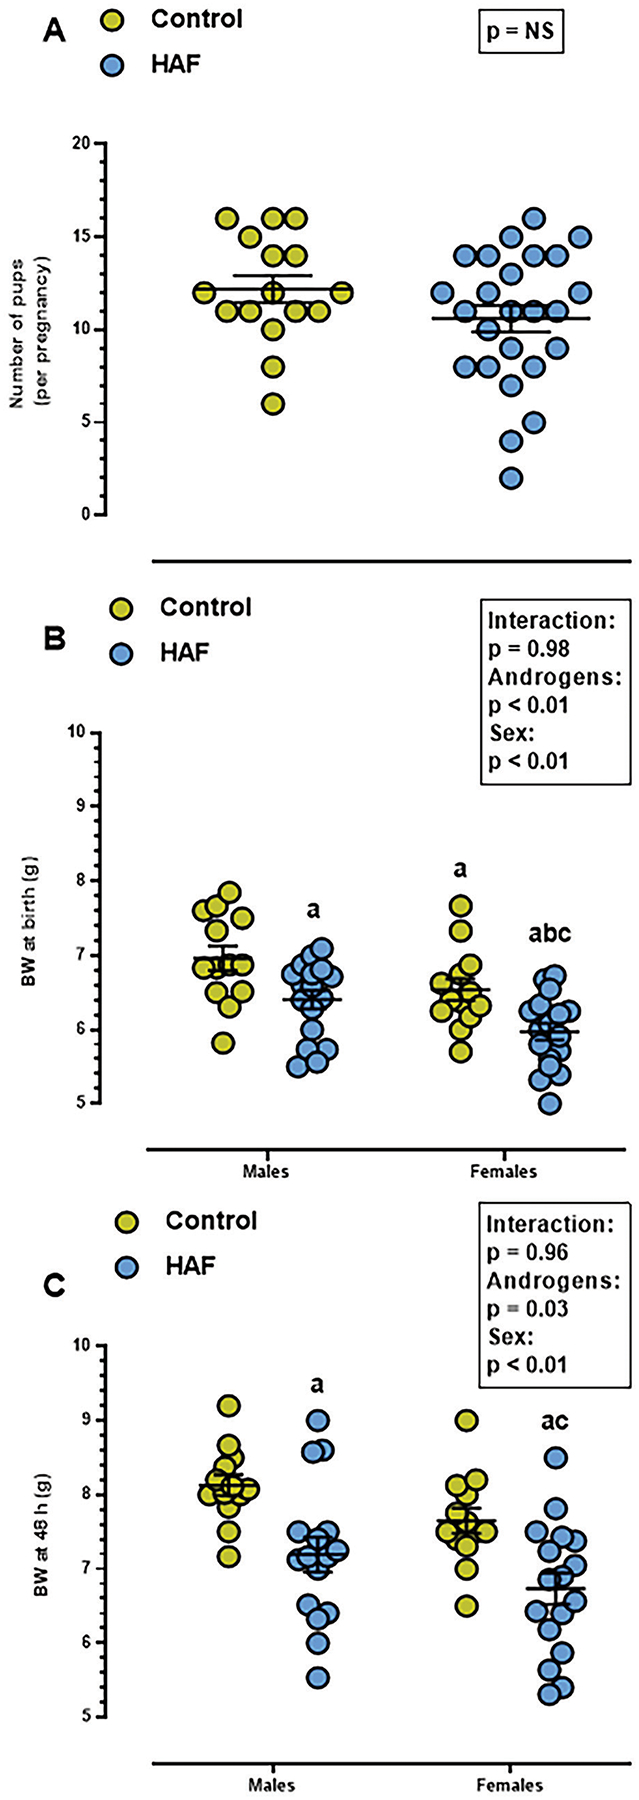
Figure 1: Number of pups per litter and body weights of HAF and control offspring.

A) There were no differences in average numbers of pups per litter between control and HAF dams (p=NS). B) Birth weights were lower in male and female HAF offspring than control offspring, and female HAF birth weights were lower than male HAF. C) At postnatal day 2, body weights remained lower in male and female HAF offspring than controls. Statistical significance using Student’s t-test (A) or 2-way ANOVA (B and C) was defined as p ≤ 0.05. a, p ≤ 0.05 compared to control males; b, p ≤ 0.05 compared to HAF male offspring; c, p ≤ 0.05 compared to control female offspring. NS: non-significant.
