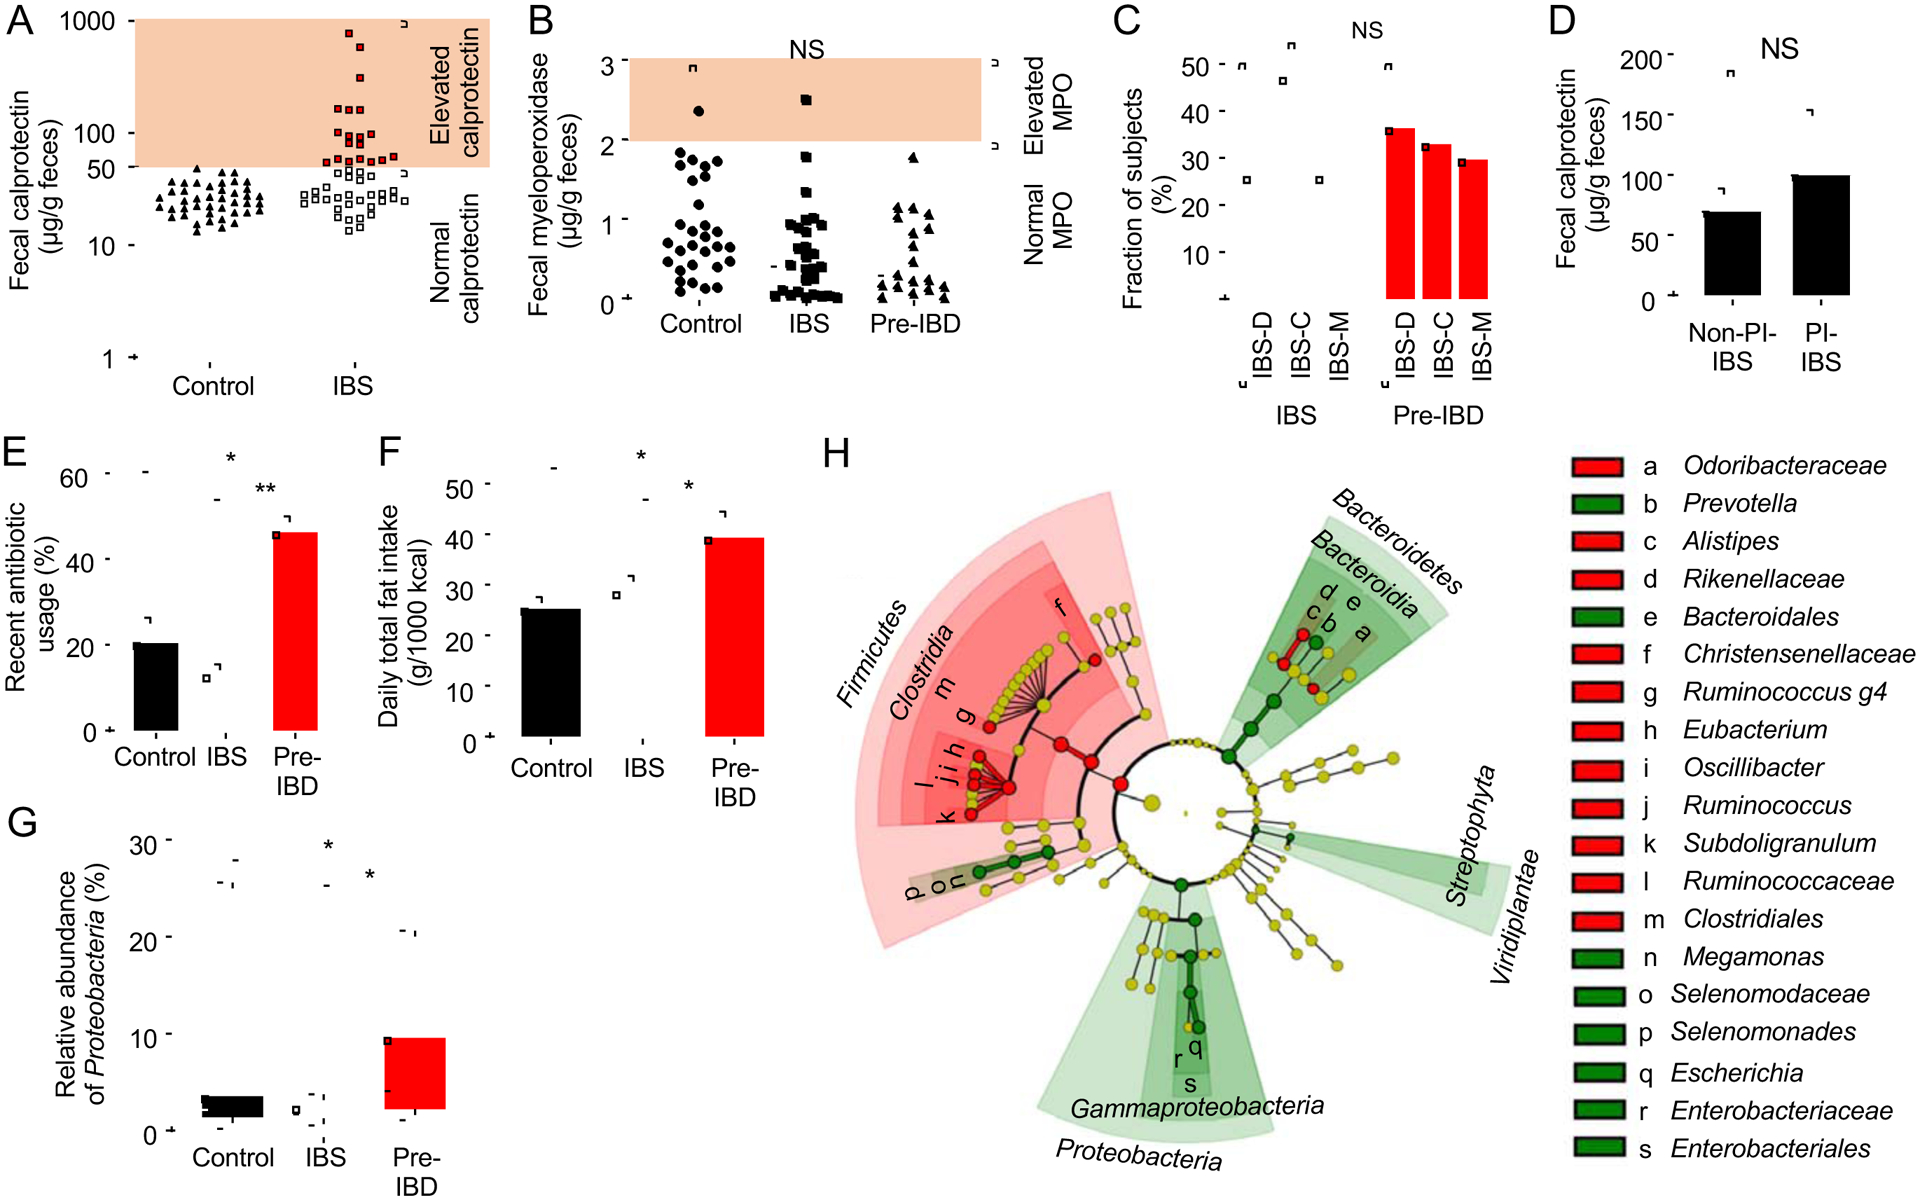
Figure 1: Subtyping patients using the biomarker fecal calprotectin identifies risk factors for pre-IBD.

(A) Levels of fecal calprotectin were measured in healthy subjects (control) and subjects with symptoms of IBS. IBS participants were sub-grouped into those with normal fecal calprotectin levels (IBS) and elevated fecal calprotectin levels (pre-IBD). (B) Levels of fecal myeloperoxidase (MPO) was measured in patients by ELISA. (C) The graph shows the percentage of IBS patients or pre-IBD patients that had stool forms consistent with IBS-C, IBS-D or IBS-M. (D) Fecal calprotectin levels in patients with PI-IBS and in patients without a history of infection (Non-PI-IBS). (E) Fraction of subjects with a history of antibiotic usage within one year. (F) Daily fat intake was determined by calculating nutrient density and expressed as intake / 1000kcal. (G) Relative abundance of Proteobacteria was determined by microbiota profiling from feces. (H) The cladogram shows differences in taxa composition determined by microbiota profiling of feces of IBS patients and pre-IBD patients. Green, elevated in pre-IBD compared to IBS; Red, reduced in pre-IBD compared to IBS. (A and B) Each symbol represents data from one individual subject. (C-F) Bars represent mean ± standard deviation. (G) The boxes in the Whisker blot represent the 1st to 3rd quartile ranges and the horizontal lines represent the median value. The bars in the whisker blot represent the minimum and maximum value in each group. *, P<0.05; NS, P>0.05. P values were calculated by one-way ANOVA followed by Bonferroni multiple comparison test (F), by Kruskal–Wallis rank test followed by Dunn’s test (A-B, D, G) or by chi square test for categorical data (C,E). See also Figure S1, S2 and S3 and Table S1, S2, S3, S4, S5 and S6
