
Figure 4: A history streptomycin treatment in mice on a high-fat diet alters epithelial energy metabolism and increases oxygen bioavailability in the colon.
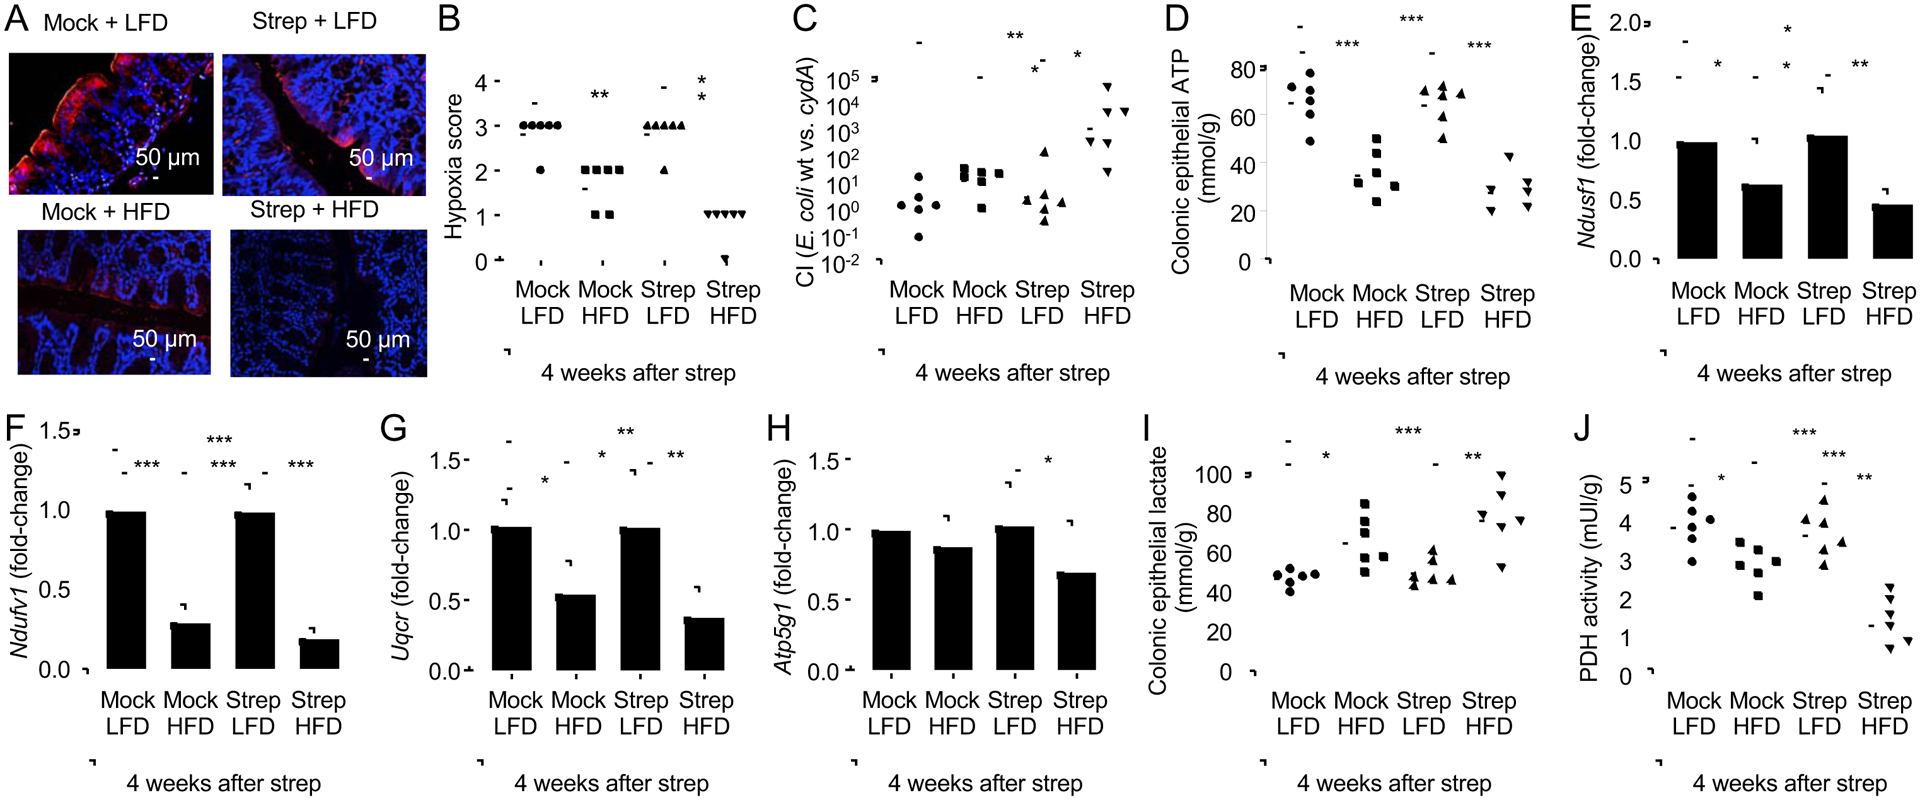
Groups of male mice (N = 6) were reared on a high-fat diet (HFD, 45% fat) or on a low-fat diet (LFD, 10% fat) and were mock treated or treated with a single dose of streptomycin (Strep) four weeks before necropsy. (A-B) Binding of pimonidazole was detected using hypoxyprobe-1 primary antibody and a Cy-3 conjugated goat anti-mouse secondary antibody (red fluorescence) in the sections of proximal colon that were counterstained with DAPI nuclear stain (blue fluorescence). (A) Representative images are shown. (B) Pimonidazole staining was quantified by scoring blinded sections of proximal colon. (C) Mice were inoculated with a 1:1 mixture of E.coli wild type (wt) and an isogenic respiration-deficient (cydA) mutant and the competitive index (CI) in colon contents was determined 4 weeks after streptomycin treatment. (D-J) Colonocytes were isolated from the colonic mucosa to measure cytosolic concentrations of ATP (D). (E-H) Transcript levels of genes encoding components of the electron transport chain, including Ndufs1 (E), Ndufv1 (F), Uqcr (G) and Atp5g1 (H) were determined by quantitative real-time PCR in RNA isolated from colonocytes. Lysates of colonocytes were used to measure cytosolic concentrations of lactate (I) and pyruvate dehydrogenase activity (PDH) (J). (B-D, I and J) Dots represent data from individual animals and bars represent geometric mean. (E-H) Bars represent geometric mean± standard deviation. *, P<0.05; **, P<0.01; ***, P<0.001; ****, P<0.0001. (C, E-H) Data were transformed logarithmically before analysis. P values were calculated by a one-tailed non-parametric test (Kruskal Wallis test) followed by Dunn’s multiple-comparison test (B) or by one-way ANOVA followed by Tukey’s multiple-comparison tests (C-J and F). See also Table S2.