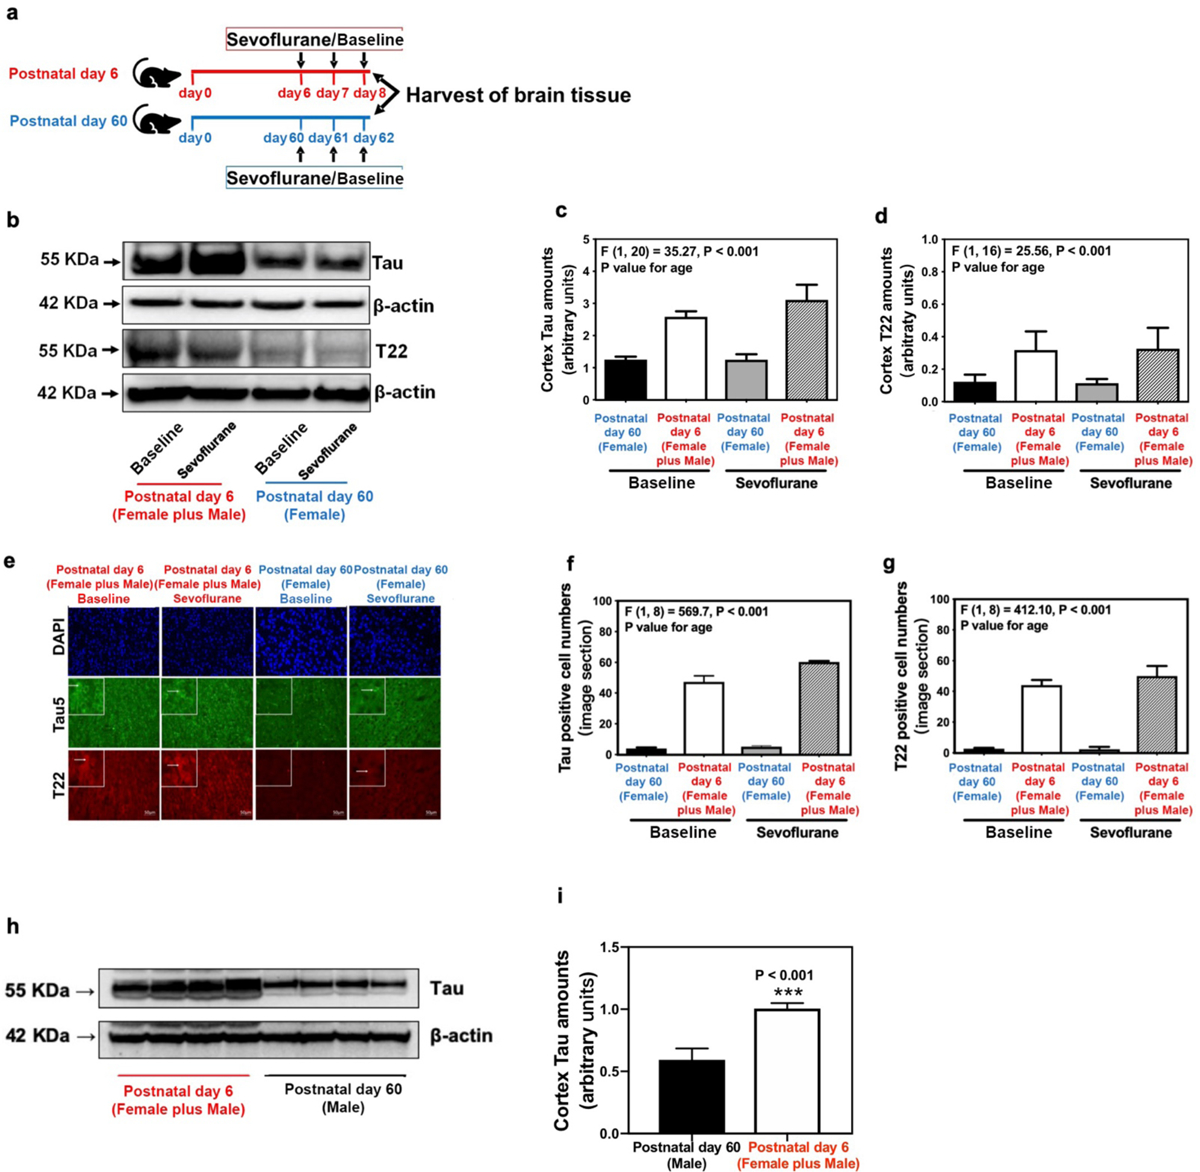
Figure 1. Difference in brain Tau amount between neonatal and adult mice.

(a) Experimental design: Cortex or hippocampus tissues were harvested at the end of the baseline or sevoflurane anesthesia in neonatal (postnatal day 6 - postnatal day 8) and adult (postnatal day 60 - postnatal day 62) mice. (b) Difference in brain amounts of Tau and oligomer Tau (T22) in the cortex of postnatal day 6 mice from both sexes (neonatal mice from both sexes) and postnatal day 60 female mice [female reference group mice (Female)] in baseline and sevoflurane anesthesia groups. (c) Summary of amounts of Tau (n=6 mice/group). (d) Summary of amounts of oligomer Tau (T22) (n=6 mice/group). (e) Immunostaining of Tau- and T22-positive cells in the cortex of neonatal mice from both sexes and female reference group mice in baseline and sevoflurane anesthesia groups. (f) Quantification of Tau-positive cells (n=3 mice/group). (g) Quantification of T22-positive cells (n=3 mice/group). (h) Difference in brain amounts of Tau and oligomer Tau (T22) in the cortex of postnatal day 6 mice from both sexes (neonatal mice from both sexes) and postnatal day 60 male mice [male reference group mice (Male)] in baseline. (i) Summary of amounts of Tau (n=6 mice/group). Data are presented as mean ± standard deviation (SD). All data are quantified and expressed as arbitrary units or real numbers compared to reference group mice (postnatal day 60) or baseline group (non-anesthetized mice). PS, phosphorylated serine; PT, phosphorylated threonine. Two-way ANOVA: (c), (d), (f) and (g). Student’s t-test: (i). ***P<0.001.
