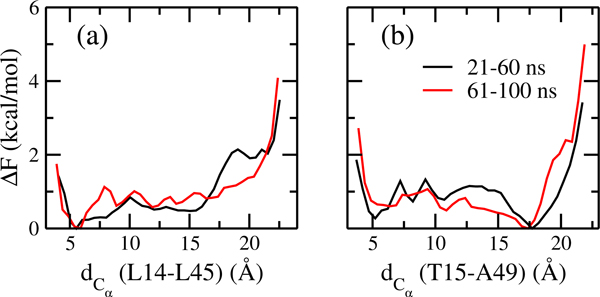
Figure 4:
Free energy (ΔF) as a function of the two Cα distances (dCα) between (a) L14 and L45 (a measure for the similarity to Ltn40) and (b) between T15 and A49 (a measure for the similarity to Ltn10), as obtained from the unbiased replica where λ = 0. Shown are values as measured for different segments of the simulation.

