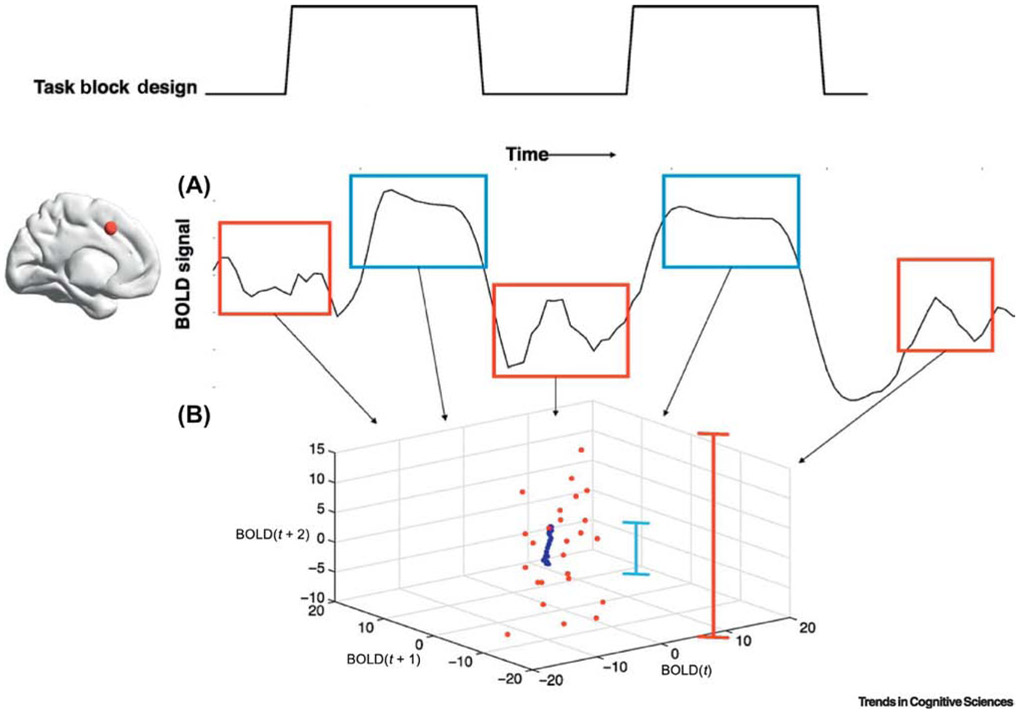
Figure 3. Modeling of cortical activity space in rest and task conditions.
A. The BOLD timeseries of a brain region exhibits increases in signal amplitude in response to a stimulus condition during task performance (blue) compared with a resting condition (red). B. BOLD signal amplitude is plotted at three time points (BOLD(t), BOLD(t+1), and BOLD (t+2). The trajectory of the brain region tightens during task performance periods and expands during resting conditions (indicated by length of the blue and red lines, respectively) [19]. This illustration of how one might conceptualize BOLD activity in terms of its trajectory in multidimensional space before and after stimulus processing is similar to computational approaches using simulated synaptic activity of brain regions to illustrate that in resting conditions, the network explores a larger volume of state space than it does in task conditions [100] (from [19], reprinted courtesy of The MIT Press).

