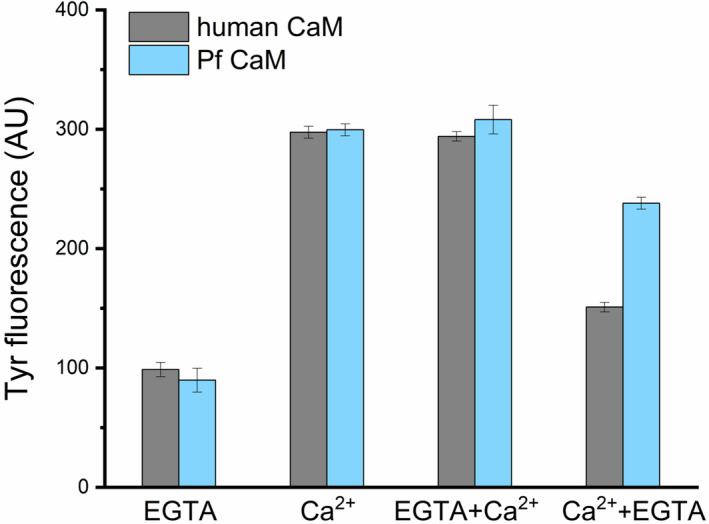
FIGURE 3.

Tyrosine fluorescence of human and Pf CaM. Spectra were recorded at 2 µmol/L protein concentration. Maximal fluorescence intensities at 303 nm were determined in the presence of added 1 mmol/L EGTA (EGTA) or 1 mmol/L CaCl2 (Ca2+), and added 2 mmol/L CaCl2 after incubation with 1 mmol/L EGTA (EGTA + Ca2+) or 2 mmol/L EGTA after incubation with 1 mmol/L CaCl2 (Ca2+ +EGTA)
