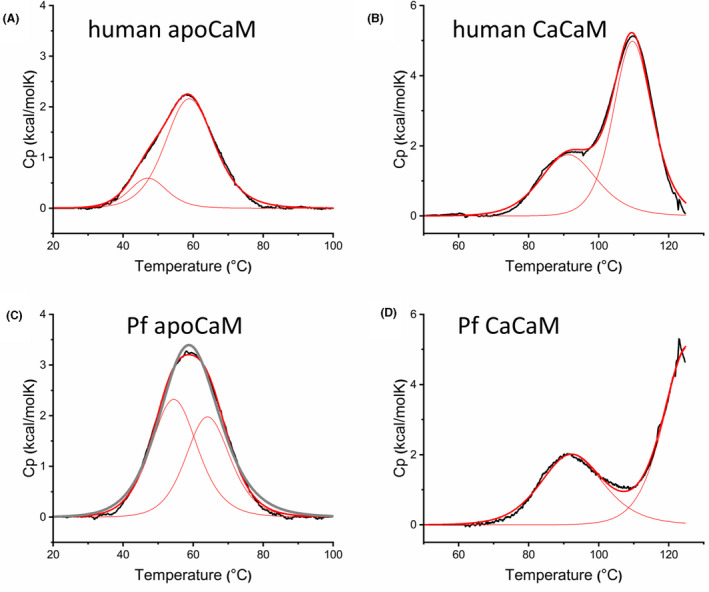
FIGURE 5.

Heat stability of human and Pf CaM. Thermal stability was studied by DSC in standard assay buffer. Excess transition heat capacity Cp is plotted against temperature (black line), fitted with a two‐state model, and deconvoluted to two individual transitions. The fitted and deconvoluted curves are shown as thick and thin red lines, respectively. For comparison, a fit assuming one single transition is also shown for Pf apoCaM (C, gray line). The calculated thermodynamic parameters are listed in Table 1
