FIGURE 6.

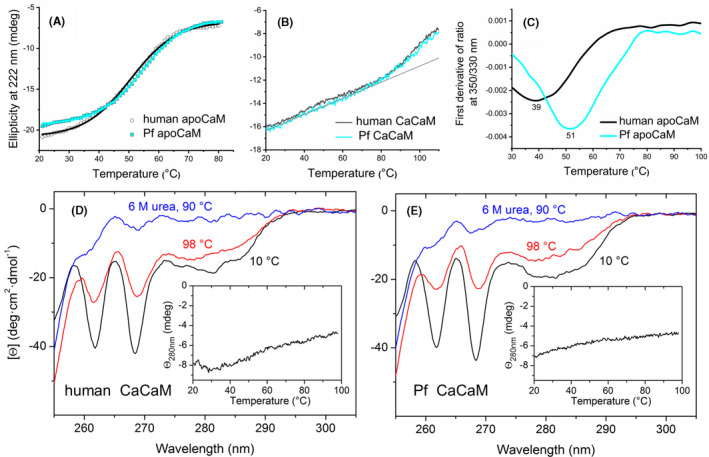
Heat stability of human and Pf CaM studied with CD spectroscopy and differential scanning fluorimetry. A‐B, Ellipticity representing helicity was recorded at 222 nm. For the apoproteins (A), ellipticity is plotted against temperature and fitted to a single sigmoid function for human CaM, (black line) and Pf CaM, (cyan line). For CaCaMs (B), the straight line shows a linear fit to data points in the low temperature range. C, Intrinsic fluorescence was monitored at 330 and 350 nm, the first derivative of the ratio is plotted, and the minimum is determined. D‐E, Near‐UV CD spectra of human and PF CaM under the indicated conditions. Insets show Tyr signal changes recorded at 280 nm upon heating. The parameters obtained (from A and C) can be found in Table 1
