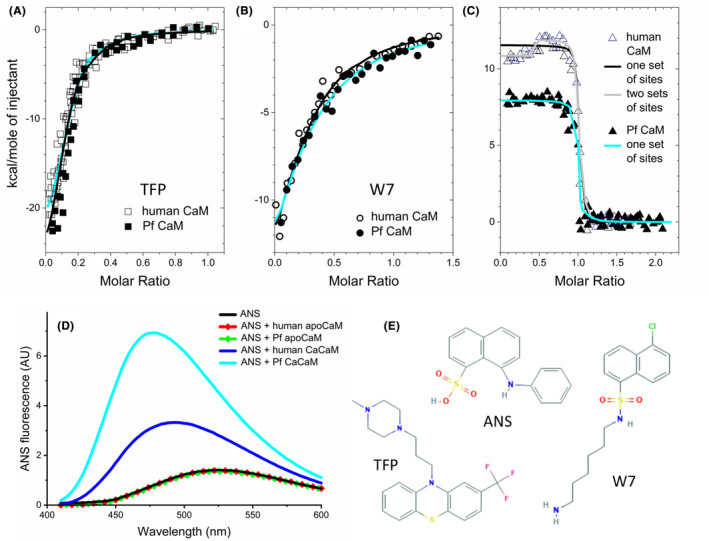
FIGURE 7.

Ligand binding of human and Pf CaM. A‐C, Binding of TFP, W7, and melittin to human and Pf CaM was studied using ITC. Dark and cyan lines show fitted curves for human and Pf CaM, respectively, using the one set of sites model. For the human CaM‐melittin binding (C), a fit with the two sets of sites model is also shown (gray line). Points are individual data from 2‐4 independent measurements. Parameters obtained from the fit with the one set of sites model are A, hCaM‐TFP: n = 7.1 ± 0.2, K d = 0.64 ± 0.19 μmol/L, PfCaM‐TFP: n = 7.3 ± 0.2, and K d = 1.0 ± 0.23 μmol/L, B, hCaM‐W7: n = 4 fixed, K d = 6.7 ± 0.7 μmol/L; PfCaM‐W7: n = 4 fixed, K d = 9.4 ± 0.8 μmol/L; C, hCaM‐melittin: n = 1.0 ± 0.1, K d < 30 nmol/L, ΔH = 11.5 ± 1.0 kcal/mol; PfCaM‐melittin: n = 1.0 ± 0.1, K d < 30 nmol/L, ΔH = 8.9 ± 0.6 kcal/mol. D, ANS binding to human and Pf CaM. Spectra represent ANS (10 μmol/L) fluorescence in the presence and absence of CaM (2 µmol/L). Note that spectra of both apoproteins totally overlap with the spectrum of free ANS, and ANS fluorescence is not affected by the Ca2+ level. E, Chemical structures of the small molecule compounds used in the binding assays. Images were taken from PubChem (https://pubchem.ncbi.nlm.nih.gov)
