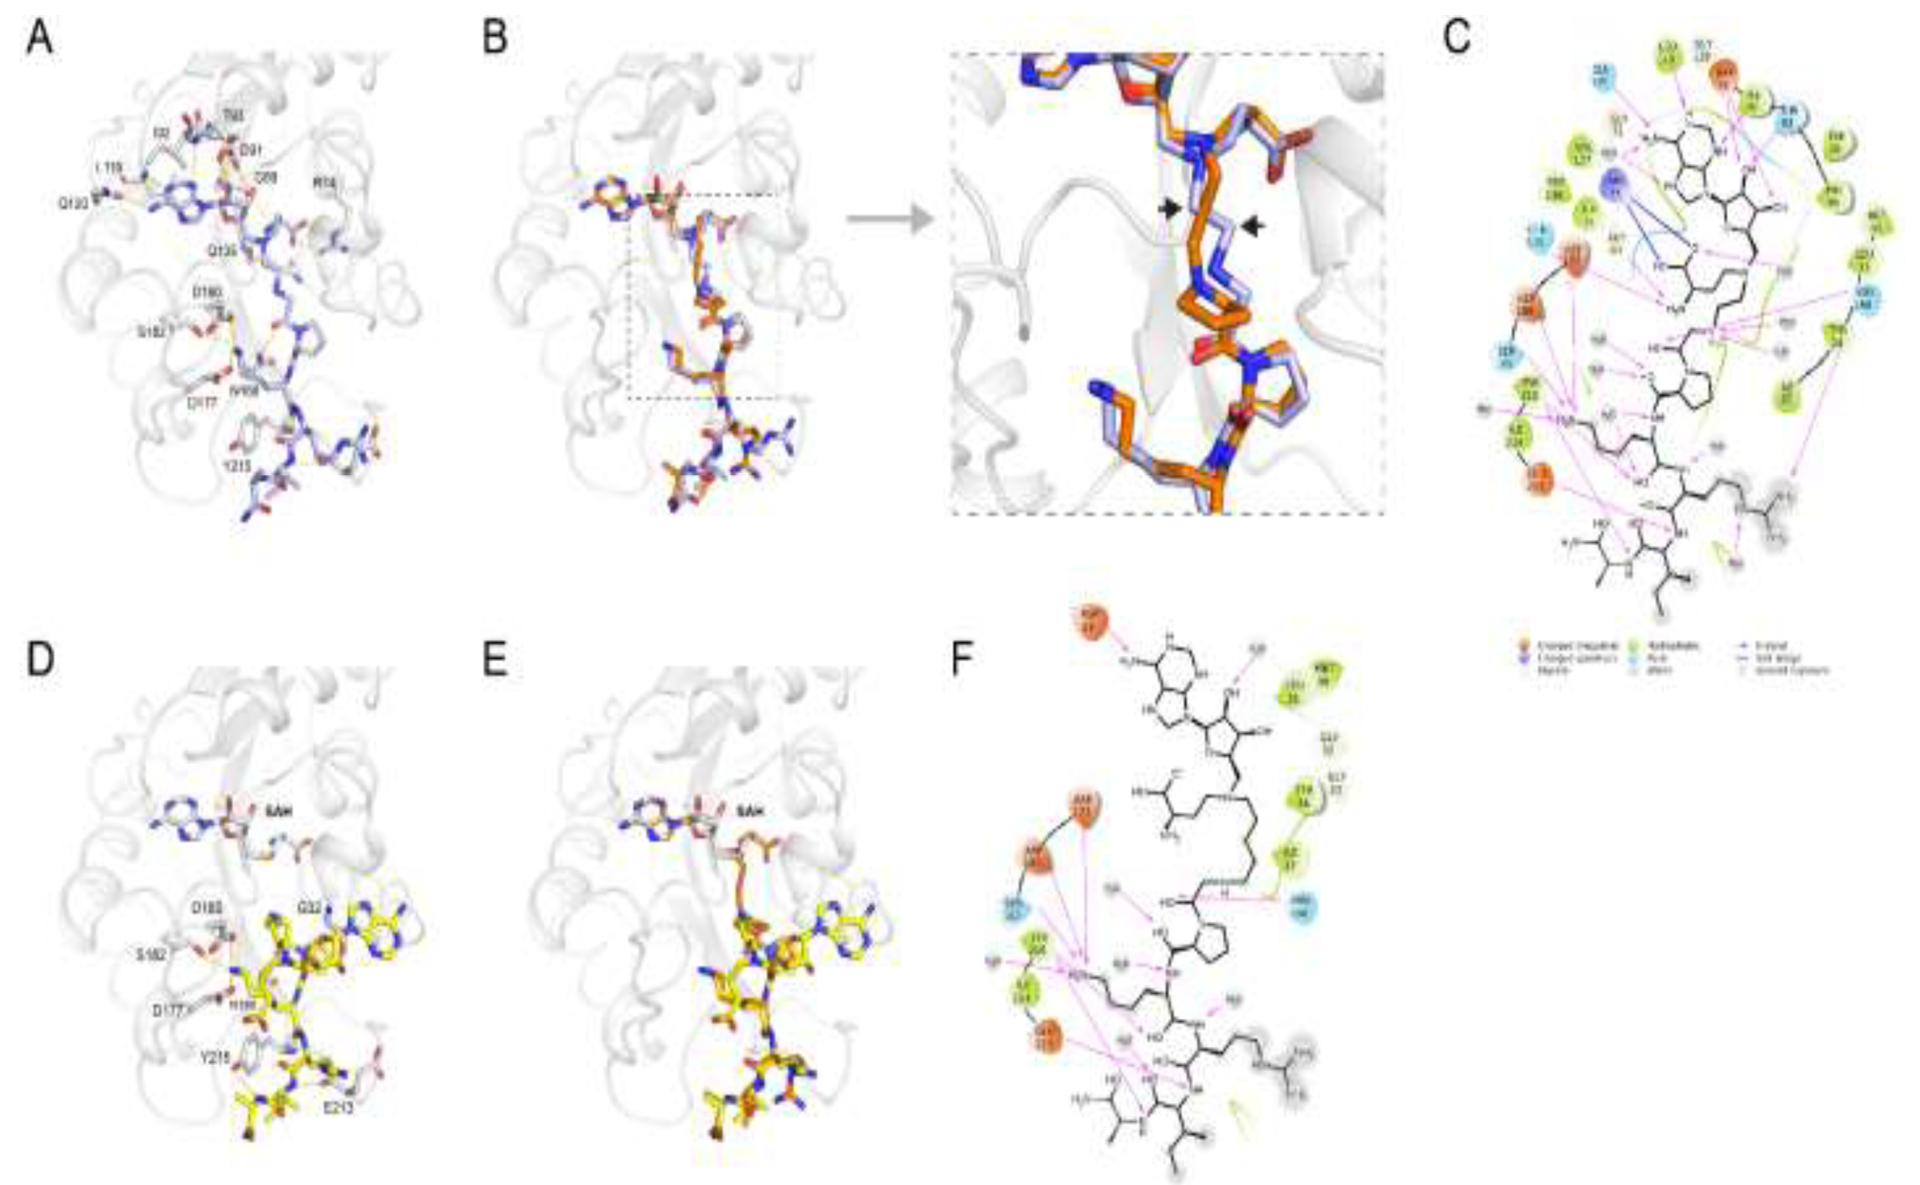
Figure 7.

X-ray co-crystal structures. (A) The X-ray crystal structure of compound 1 (purple stick) in complex with NTMT1 (gray ribbon) (PDB code: 6WJ7). H-bond interactions are shown in yellow dotted lines; (B) Overlay of the crystal structure of NTMT1(gray ribbon)-1 (purple stick) complex with the crystal structure of the NTMT1-NAH-C3-PPKRIA (orange stick) binary complex (PDB code: 6DTN); (C) Compound 1 2D interaction diagram (Schrödinger Maestro) with NTMT1; (D) The X-ray crystal structure of NTMT1(gray ribbon)-4 (yellow stick)-SAH (gray stick) (PDB code: 6PVB). H-bond interactions are shown in yellow dotted lines; (E) Overlay of the crystal structure of NTMT1(gray ribbon)-4 (yellow stick)-SAH (gray stick) complex (PDB code: 6PVB) with the crystal structure of NTMT1-NAH-C3-PPKRIA (orange stick) binary complex (PDB code: 6DTN); (F) Compound 4 2D interaction diagram (Schrödinger Maestro) with NTMT1.
