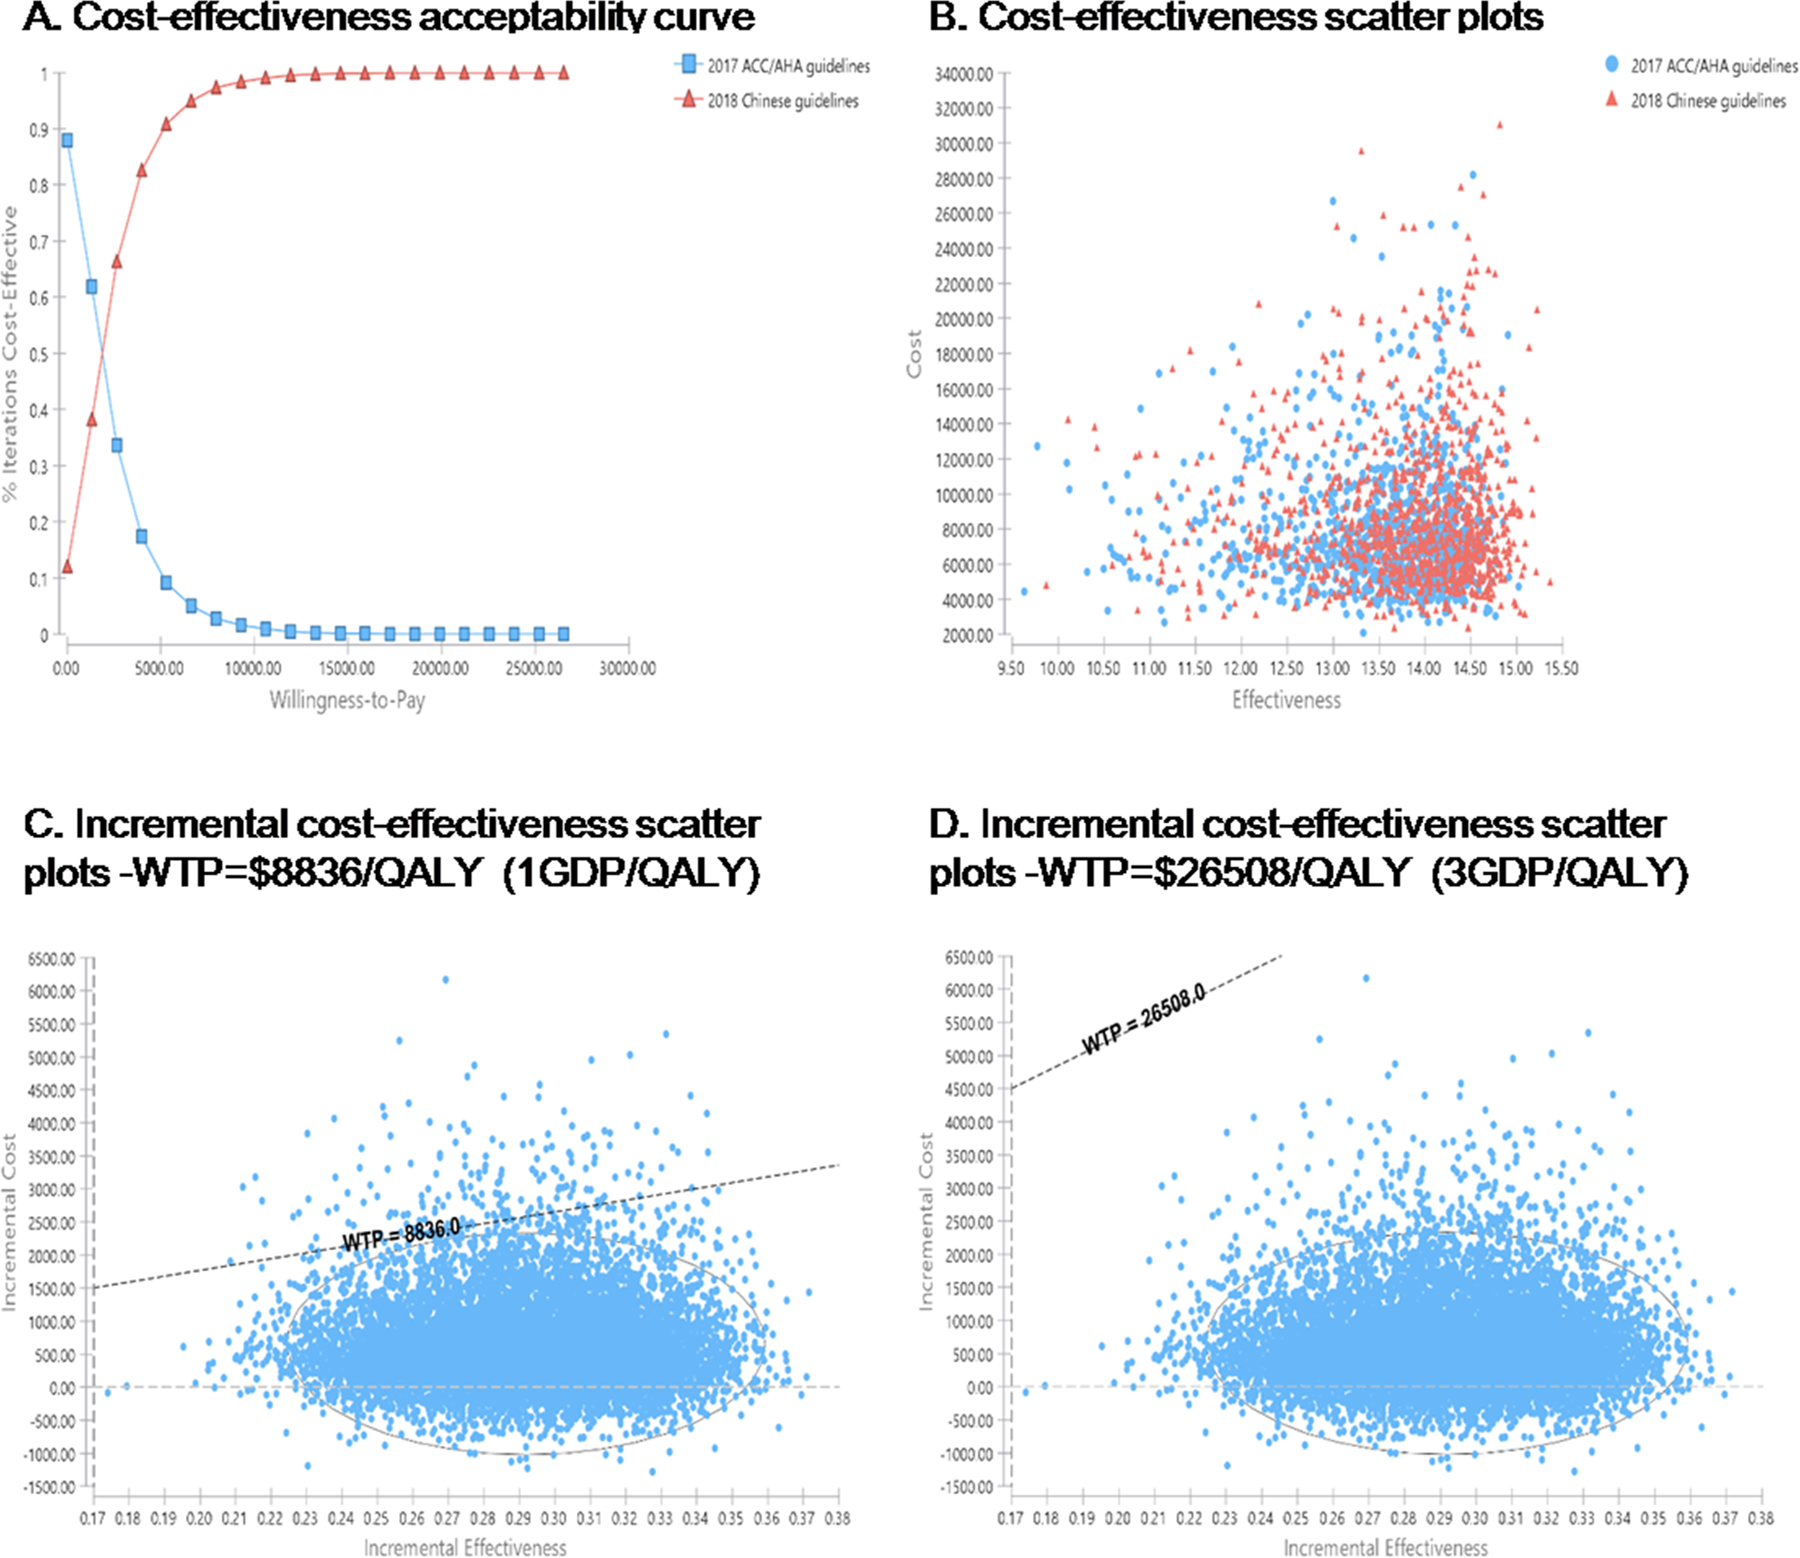
Figure 2.

Cost-effectiveness acceptability curve and cost-effectiveness scatter plots of the 2018 Chinese guidelines versus 2017 ACC/AHA guidelines for stage I hypertensive patients. A, Cost-effectiveness acceptability curve. B, Cost-effectiveness scatter plots. C, Incremental cost-effectiveness scatter plots-WTP=$8836/QALY (1GDP/QALY). D, Incremental cost-effectiveness scatter plots-WTP=$26508/QALY (3GDP/QALY). ACC/AHA indicates American College of Cardiology/American Heart Association; QALY, quality-adjusted life year; GDP, gross domestic product; and WTP, willingness-to-pay.
