
Figure 3.
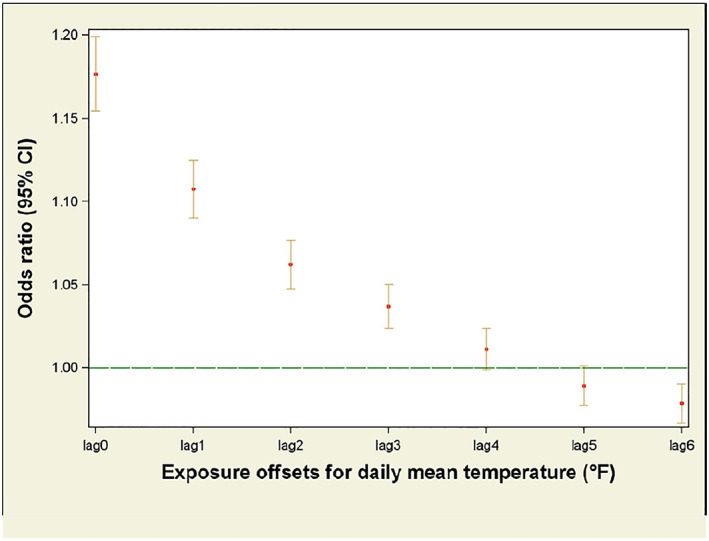
Odds ratios of daily mean temperatures as a predictor for work‐related hyperthermia emergency department visits, stratified by lag days. A lag period accounts for delayed or extended health effects associated with an exposure. Odds ratios for lag days 1–3 were elevated (i.e., >1); lag days 4–6 were not. Lag day 0 is the day of visit.