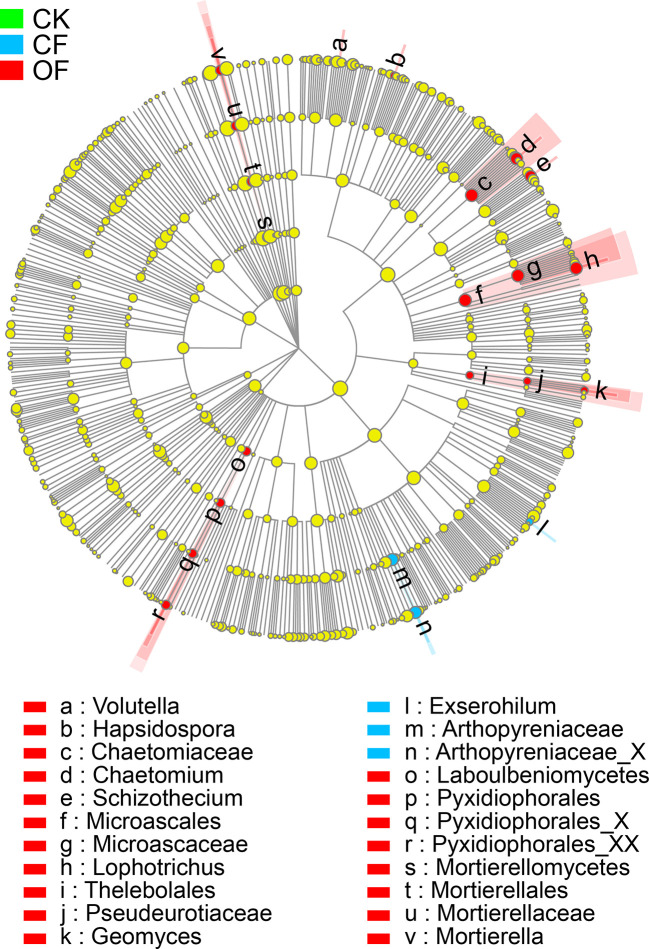
Figure 4.
Cladogram showing the phylogenetic distribution of fungal lineages in soils. The taxa of fungi with significantly enriched abundances treated with organic fertilizer (OF), chemical fertilizer (CF), or without fertilizer (CK) are represented by red, blue, or green dots, respectively. The taxa with the absolute LDA scores >2.5 and p < 0.05 are shown.

