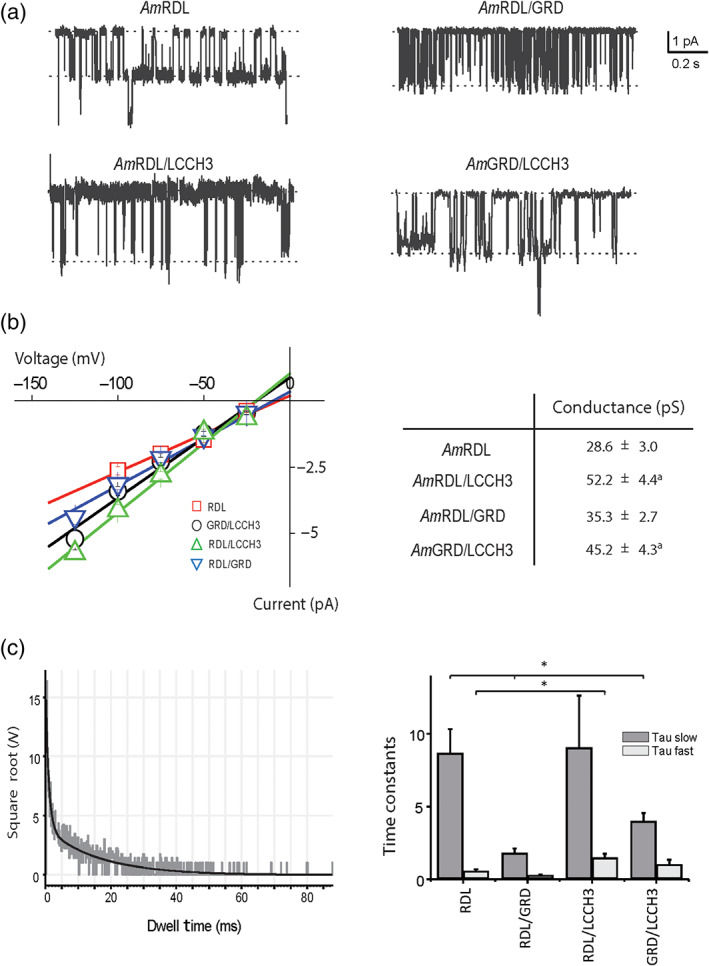
FIGURE 6.

Single‐channel recording of AmGABA receptors. (a) Representative single‐channel current traces recorded from Xenopus oocyte expressing AmRDL, AmRDL/LCCH3, AmRDL/GRD, and AmLCCH3/GRD under symmetrical concentrations of KCl (100 mM). (b) Current–voltage curves (left) for AmRDL, AmRDL/LCCH3, AmRDL/GRD, and AmLCCH3/GRD, and corresponding deduced conductances (right). (c) Open dwell time distribution for AmGABA receptors. On the left, a representative example illustrating AmRDL/LCCH3 receptors open dwell times. On this graph, the black curve plots the distribution which follows bi‐exponential decay. On the right are shown histograms depicting tau fast and tau slow obtained from the fitting of the open dwell time for AmRDL (n = 8), AmRDL/LCCH3 (n = 5), AmRDL/GRD (n = 5), and AmLCCH3/GRD (n = 11). *P < .05, significantly different as indicated; Holm–Sidak method
