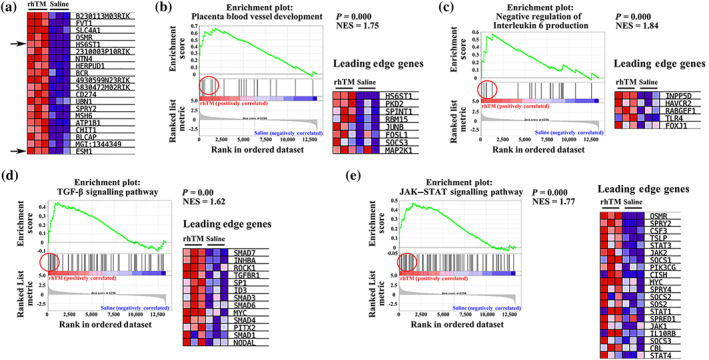
FIGURE 5.

Gene set enrichment analysis. (a) Correlation of heat map and gene list for the top 20 genes of gene set enrichment analysis. (b–e) Enrichment plots and leading‐edge gene lists. (b) Placental blood vessel development, (c) negative regulation of IL‐6 production, (d) TGF‐β signalling pathway, and (e) JAK–STAT signalling pathway. NES, normalised enrichment score
