
FIGURE 8.
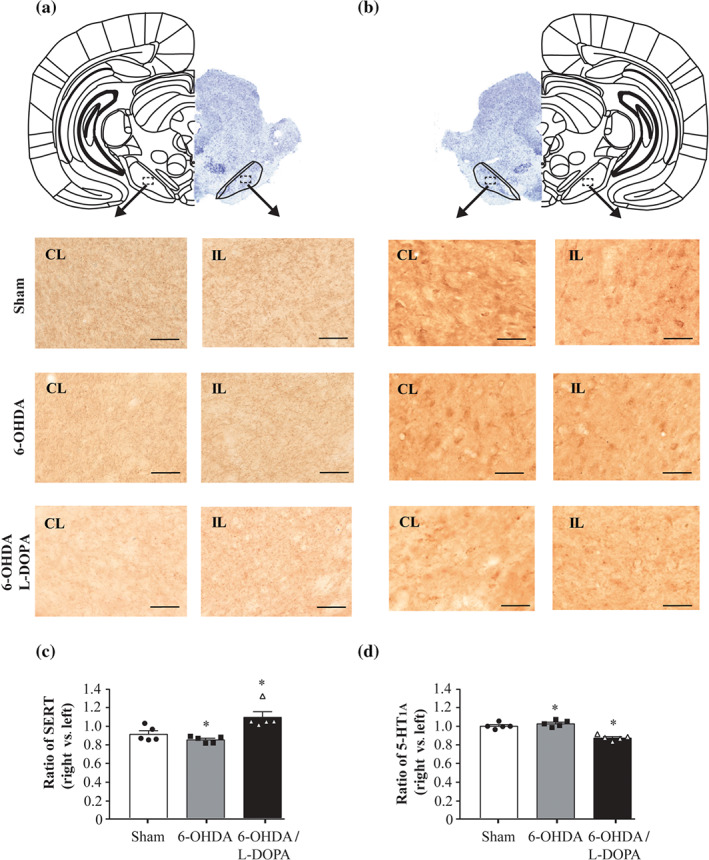
Coronal sections immunoassayed for SERT axon terminals (a) and 5‐HT1A receptors (b) of the SNr. Micrographs at 20× magnifications for the three experimental groups. In the top of the figure, a representative brain coronal section of the SNr (Nissl staining) with delimited sections from ipsilateral (IP) and contralateral (CL) hemispheres. Scale bar = 50 μm. While the IOD of SERT terminals left/right ratio shows a significant increase in SERT terminals (c), 5‐HT1A receptor left/right ratio shows a significant decrease in 6‐OHDA/l‐DOPA group (d). Sham (n = 5), 6‐OHDA‐lesioned (n = 5), and 6‐OHDA/l‐DOPA (n = 5). Each bar represents the mean ± SEM. * P < 0.05 versus sham (one‐way ANOVA followed by Bonferroni's post hoc test)