. 2020 Jul 28;39(16):e103009. doi: 10.15252/embj.2019103009

Figure EV1. Exosomes are made inside Rab11 compartments in Drosophila secondary cells.

Figure EV1

  • A
    Bar chart showing the number of ILVs within specific size ranges in the non‐acidic compartments of SCs expressing CD63‐GFP. Each dot represents number of vesicles within each size range in a single compartment. The size of all ILVs was measured from 3D‐SIM images of at least three compartments for three SCs per gland from three different animals (producing at least 27 dots per size range).
  • B
    Bar chart shows average number of large (diameter greater than two micrometres), non‐acidic dense‐core granule compartments (identified using DIC microscopy) in SCs from w 1118, YFP‐Rab11 gene trap, SC>Btl‐GFP and SC>CD63‐GFP male flies. Note that the number of these compartments is increased by CD63‐GFP expression, as previously reported (Redhai et al, 2016), but not by the other transgenes. Counts are for three SCs per gland from 10 different animals.
  • C
    Bar chart shows average number of large (diameter greater than two micrometres), LysoTracker Red®‐positive, acidic compartments (LELs) in different genetic backgrounds. The number of acidic compartments is slightly increased by the YFP‐Rab11 gene trap and SC > Btl‐GFP. Counts are for three SCs per gland from 10 different animals.
  • D
    Bar chart shows average size of the largest acidic LEL compartment in these genetic backgrounds. This is slightly reduced by the YFP‐Rab11 gene trap and increased by CD63‐GFP. Sizes were measured for three SCs per gland from 10 different animals.
  • E
    Transmission electron micrograph of a w 1118 non‐transgenic fly SC in the AG epithelium with boxes showing location of enlarged images, marked by coloured dots. In the magnified green dot image, most large compartments lacking dense‐core granules are equivalent to the acidic compartments seen in live fluorescence imaging (Corrigan et al, 2014). Arrows mark exosome‐sized (30–150 nm diameter) vesicles. Arrowheads mark complex membranous structures, characteristic of lysosomal compartments. In the magnified red and yellow dot images, large non‐acidic, dense‐core granule compartments have previously been reported to be Rab11‐positive (Redhai et al, 2016). Arrows mark ILVs. Arrowhead in each image marks dense‐core granule, which is surrounded by filamentous material (Corrigan et al, 2014).
  • F–K
    Wide‐field fluorescence images of living fly secondary cells (SCs) and paired accessory glands (AGs; K), and confocal images of fixed AG lumens (G–I). Focal planes indicated in Fig 1A schematics. Acidic compartments are marked by the vital dye LysoTracker® Red (magenta); GFP‐ and YFP‐tagged constructs are shown in yellow. (F) Basal view of an SC expressing a YFP‐Rab11 gene trap, with cell outline approximated by dashed white circle. Rab11 compartment highlighted by box contains three large ILVs (arrowhead) with Rab11 marking their outlines. (G) Transverse view of an SC from a fly in which CD63‐GFP is expressed specifically in SCs under GAL4/UAS control. CD63‐GFP is present on both the limiting and ILV membranes of acidic and non‐acidic compartments, in addition to the apical plasma membrane (arrows in merge). Image is also shown schematically. CD63‐GFP puncta (arrows) are present in the AG lumen of these flies. (H) Transverse view of an SC expressing a YFP‐Rab11 gene trap, which marks non‐acidic compartments, and also the cytosol, but is not trafficked to the apical plasma membrane (arrows in merge). Image is also shown schematically. Absence of YFP‐Rab11 throughout the apical plasma membrane is shown in the Z‐stack in Movie EV2. YFP‐Rab11 puncta (arrows) are present at low levels in the AG lumen. (I) Basal view of an SC from a fly expressing SC‐specific YFP‐Rab11 (yellow) under GAL4/UAS control, with cell outline approximated by dashed white circle. Boxed non‐acidic compartment is magnified in Zoom; arrows highlight YFP‐Rab11‐positive ILVs (Merge) and puncta present at low levels (AG lumen). (J) Basal view of an SC from a fly expressing the YFP‐Rab11 gene trap (yellow) and SC‐specific CD63‐mCherry (magenta) under GAL4/UAS control, with cell outline approximated by dashed white circle. Large non‐acidic compartments with CD63‐mCherry at their limiting membrane appear to exclude YFP‐Rab11 from their surface (boxes 1 and 2). In the compartment lumen, co‐localisation of the markers is observed (white arrowheads; box 1), but also non‐overlapping fluorescence (coloured arrowheads; box 2), consistent with ILV heterogeneity in a single compartment. (K) AGs from a fly expressing nuclear GFP under the control of a well‐characterised btl‐GAL4 enhancer trap (Hayashi et al, 2002). Boxed region of AG epithelium containing SCs is enlarged in Zoom, with SC outlines approximated by dashed white circles. GFP localisation in binucleate SCs suggests that btl is normally expressed in SCs.
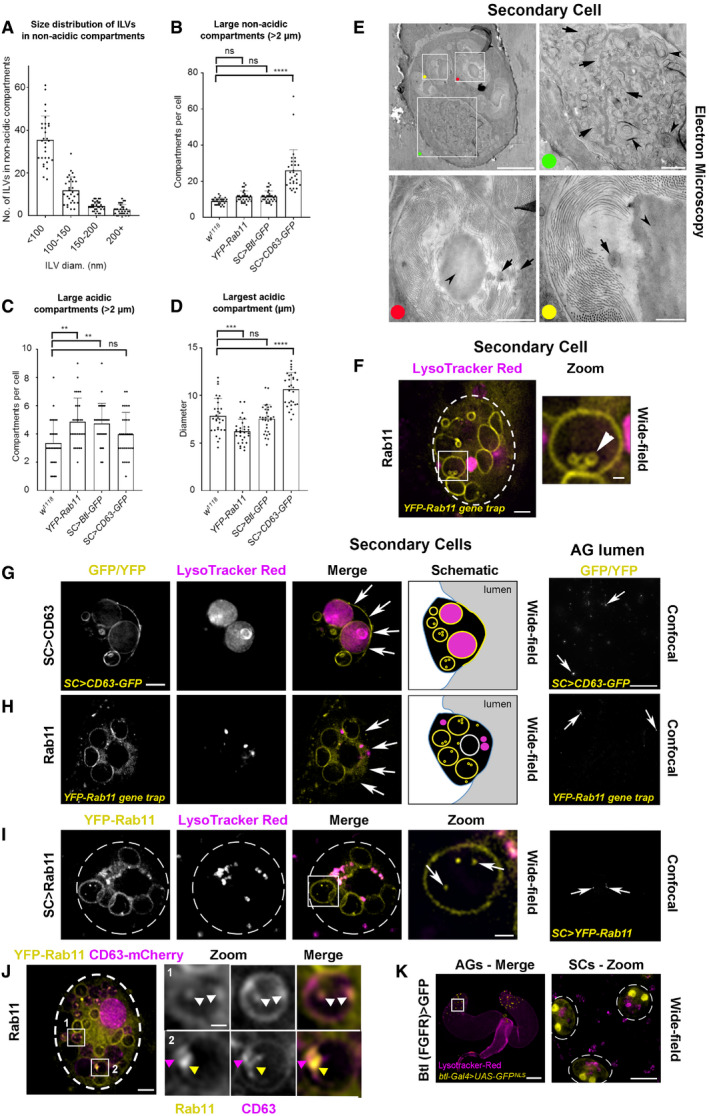
Data information: All images and data are from 6‐day‐old males shifted to 29°C at eclosion. Genotypes of flies carrying multiple transgenes are as follows: w; P[w + , UAS‐CD63-GFP] P[w + , tub‐GAL80 ts ]/+; dsx‐GAL4/+ (A–D, G), w; P[w + , tub‐GAL80 ts ]/+; dsx‐GAL4/P[w + , UAS‐btl-GFP] (B–D); w; P[w + , tub‐GAL80 ts ]/+; dsx‐GAL4/P[w + , UAS‐YFP-Rab11] (I), w; P[w + , tub‐GAL80 ts ]/+; dsx‐GAL4, TI{TI}Rab11 EYFP/P[w + , UAS‐CD63-mCherry] (J); w; P[w + , UAS‐GFP nls ]/+; btl NP6593/+ (K). Scale bar in G (5 μm) applies to G‐J, and in AG lumen in G (20 μm) applies to G‐I. Other scale bars are as follows: 5 μm (E), 1 μm (E, green and red dots), 0.5 μm (E, yellow dot), 5 μm (F, J), 1 μm (F and J, Zoom), 2 μm (I, Zoom), 250 μm (K), 20 μm (K, Zoom). For A‐D, values for transgenic flies are compared to w 1118, using one‐way ANOVA. ****P < 0.0001; ***P < 0.001; **P < 0.01; ns = not significant. Bars and error bars denote mean ± SD.