-
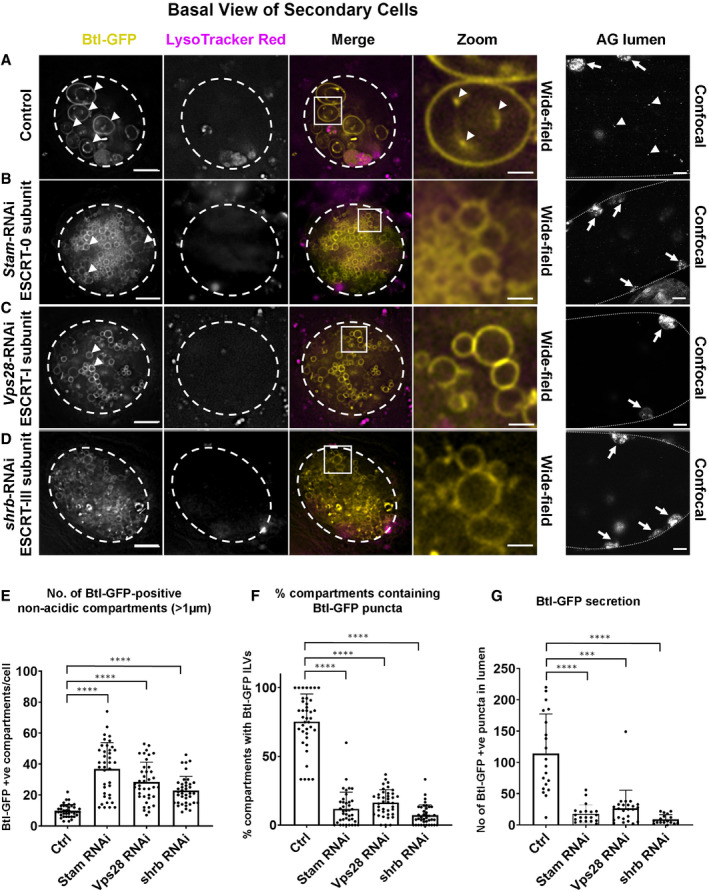
A–D
Wide‐field fluorescence images of basal views through living SCs expressing a GFP‐tagged form of Btl‐GFP (yellow) in non‐acidic compartments, with SC outline approximated by dashed white circles. Acidic compartments are marked by LysoTracker Red® (magenta). Boxed non‐acidic compartments in merge images are magnified in A–D, Zoom. On the right, lower magnification confocal transverse images of fixed accessory gland (AG) lumens are shown with dotted lines indicating the basal side of the AG epithelial layer, which contains several fluorescent SCs (highlighted by arrows). (A) SC with no RNAi construct expressed (control) and AG lumen from same genotype. Btl‐GFP-positive compartments containing fluorescent ILVs (in Btl‐GFP panel), ILV membranes inside compartments (in Zoom panel) and secreted fluorescent puncta (AG lumen panel) are marked by arrowheads. (B) SC also expressing RNAi construct targeting ESCRT‐0 subunit, Stam, and AG lumen from same genotype. Btl‐GFP-positive ILVs (Zoom) and secreted puncta (AG lumen) are strongly reduced. (C) SC also expressing RNAi construct targeting ESCRT‐I subunit, Vps28, and AG lumen from same genotype. Btl‐GFP-positive ILVs (Zoom) and secreted puncta (AG lumen) are strongly reduced. (D) SC also expressing RNAi construct targeting ESCRT‐III subunit, shrb, and AG lumen from same genotype. Btl‐GFP-positive ILVs (Zoom) and secreted puncta are strongly reduced.
-
E
Bar chart showing the number of large (diameter greater than one micrometre) non‐acidic Btl-GFP‐positive compartments per SC. Data from 39 SCs (three per gland) are shown.
-
F
Bar chart showing percentage of these large Btl‐GFP compartments containing Btl-GFP‐positive ILVs in control and ESCRT knockdown SCs. Data from 39 SCs (three per gland) are shown.
-
G
Bar chart showing the total number of Btl‐GFP fluorescent puncta in 10 Z‐planes from the AG lumen following ESCRT knockdown in SCs, compared to controls without knockdown. Data from at least 17 AG lumens per condition are shown.
Data information: All data are from 6‐day‐old male flies shifted to 29°C at eclosion to induce expression of transgenes. Genotypes are as follows:
w; P[w
+
, tub‐GAL80
ts
]/
+;
dsx‐GAL4/
P[w
+
, UAS‐btl-GFP] with no knockdown construct (A), UAS‐
Stam‐RNAi (HMS01429; B), UAS‐
Vps28‐RNAi (v31894; C) or UAS‐
shrb‐RNAi (v106823; D). Scale bars in A‐D (5 μm); in A–D Zoom (1 μm); in A–D, AG lumen (20 μm). Data were analysed by one‐way ANOVA. ****
P < 0.0001, ***
P < 0.001 relative to control. Bars and error bars in E–G denote mean ± SD.
Source data are available online for this figure.