-
A–D
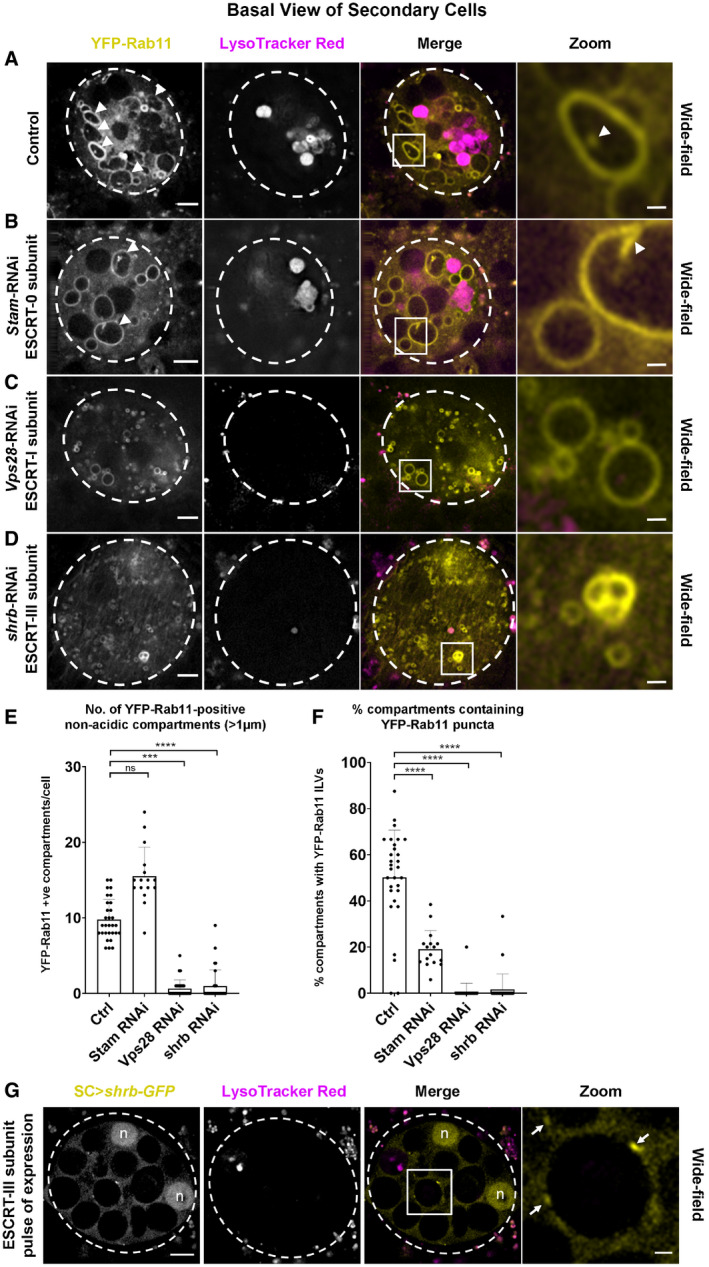
Basal wide‐field fluorescence views through living secondary cells (SCs) expressing the YFP‐Rab11 gene trap, with cell outline approximated by dashed white circle. Acidic compartments are marked with LysoTracker Red® (magenta). Boxed non‐acidic compartment in Merge is magnified in Zoom. (A) SC with no RNAi expressed (control). Arrowheads in left‐hand panels mark YFP‐Rab11‐positive compartments with internal ILV puncta. In right‐hand panel, arrowhead marks intraluminal puncta (Zoom). (B) SC also expressing RNAi targeting ESCRT‐0 component, Stam. Number of Rab11‐positive compartments is unchanged, but few contain ILV puncta (arrowheads and specific example highlighted in Zoom). (C) SC also expressing RNAi targeting ESCRT‐I component, Vps28. Number of small Rab11‐positive compartments is increased, but few are > 1 μm in diameter and virtually none contain ILVs (Zoom). (D) SC also expressing RNAi targeting ESCRT‐III component shrb. Number of small Rab11‐positive compartments is increased, but few are > 1 μm in diameter and virtually none contain ILVs (Zoom).
-
E
Bar chart showing the number of large (greater than one micrometre in diameter) non‐acidic compartments marked by YFP‐Rab11 in control and ESCRT knockdown SCs. Data from 30 SCs (three per gland; n = 16 for Stam‐RNAi; most values are zero for Vps28 and shrb knockdown) are shown.
-
F
Bar chart showing the proportion of large (greater than one micrometre in diameter) non‐acidic compartments containing YFP‐Rab11‐positive ILV puncta in control and ESCRT knockdown SCs. Data from 30 SCs (three per gland; n = 16 for Stam‐RNAi; most values are zero for Vps28 and shrb knockdown) are shown.
-
G
Basal wide‐field fluorescence view through living secondary cell (SC) after a 4‐h pulse of Shrb‐GFP (yellow) expression, with cell outline approximated by dashed white circle. Acidic compartments are marked with LysoTracker Red
® (magenta). Boxed non‐acidic compartment in Merge is magnified in Zoom. Arrows highlight Shrb‐GFP localisation on the limiting membranes of large non‐acidic compartments (Zoom). Complete view of Z‐stack is shown in
Movie EV3. Nuclear staining (marked “n”) of these binucleate cells is non‐specific.
Data information: All images are from 6‐day‐old male flies shifted to 29°C at eclosion, except for G, where flies were cultured at 25°C for 6 days before 29°C pulse. Genotypes are as follows:
w; P[w
+
, tub‐GAL80
ts
]/
+;
dsx‐GAL4 TI{TI}Rab11
EYFP/
+ with no knockdown construct (A), UAS‐
Stam‐RNAi (HMS01429; B), UAS‐
Vps28‐RNAi (v31894; C) or UAS‐
shrb‐RNAi (v106823; D). Genotype of male in G is
w; P[w+, UAS‐shrb-GFP]/
P[w
+
, tub‐GAL80
ts
]; dsx‐GAL4/
+. Scale bar in A–D and G (5 μm) and in A–D and G Zoom (1 μm). Data were analysed by the Kruskal–Wallis test (E) and one‐way ANOVA (F). ****
P < 0.0001, ***
P < 0.001, n.s. = not significant. Bars and error bars in panels E and F denote mean ± SD.

