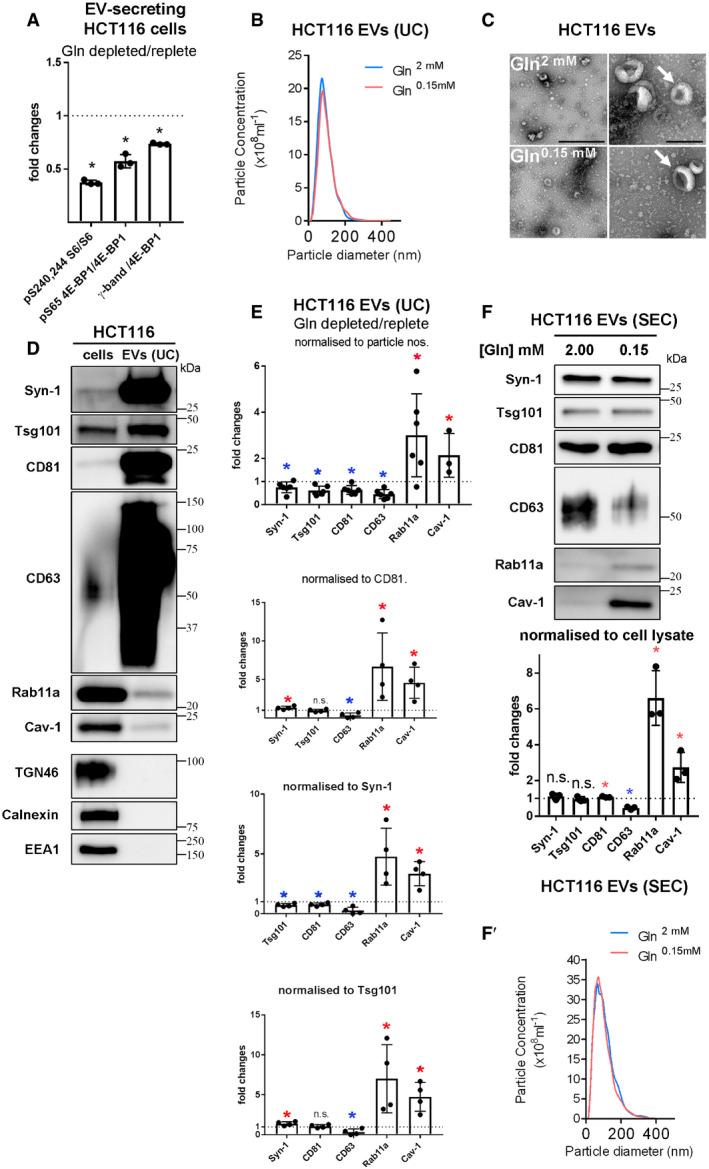
Figure EV3. Effects of glutamine depletion on HCT116 cells and their EVs.

Panels show the effect of different treatments on HCT116 colorectal cancer cells and on the EVs they secrete.
- Bar chart showing relative levels of phosphorylation of mTORC1 downstream readouts, S6 and 4E‐BP1 (measured as a ratio of p‐S65-4E‐BP1 to pan 4E‐BP1 or of the γ‐phosphorylated form of 4E‐BP1 relative to total 4E‐BP1), following growth of cells for 24 h in glutamine‐depleted (2.00 mM) versus glutamine‐replete (0.15 mM) conditions. Data are from triplicate experiments, analysed as in Fig 4A.
- Nanosight Tracking Analysis of EV size and number for diluted samples (normalised to cell lysate protein levels) produced from ultracentrifugation (UC) of medium from cells cultured in glutamine‐replete and glutamine‐depleted conditions for 24 h, as in Fig 4B.
- Electron micrographs (EMs) of EV samples from glutamine‐replete and glutamine‐depleted cells as analysed in (B). Arrows indicate representative EVs with the characteristic cup‐shaped morphology previously reported. Scale bars represent 500 nm (left panels) and 200 nm (right panels).
- Comparative Western analysis of putative exosome and non‐exosome markers in HCT116 cell lysate (cells) and EV preparation produced by UC from cells grown in glutamine‐replete conditions (EVs). Lanes are loaded with equal amounts of protein. Note that unlike other “classical” exosome markers, Rab11a and Cav‐1 are present, but not enriched in EVs, while Golgi (TGN46), ER (calnexin) and early endosome (EEA1) markers are absent.
- Bar charts show changes in levels of putative exosome proteins in EVs produced by UC from cells grown in glutamine‐depleted versus glutamine‐replete conditions and analysed as in Fig 4B. Protein quantities in each sample were normalised to EV particle number, CD81, Syn‐1 and Tsg101 in the four graphs (n = 4, except for particle number, where n = 6). All show an increase in Rab11a and Cav‐1, and a decrease in CD63, while small or no change is seen for other markers.
- Western blot analysis of EV preparations isolated from HCT116 cells cultured in glutamine‐replete and glutamine‐depleted conditions for 24 h using size‐exclusion chromatography (SEC; fractions two to four). EV loading was normalised to protein levels in cell lysates. Bar chart shows relative levels of putative exosome markers normalised to cell lysate protein mass (n = 3). (F′) Nanosight Tracking Analysis of EV size and number for samples produced as in (F).
