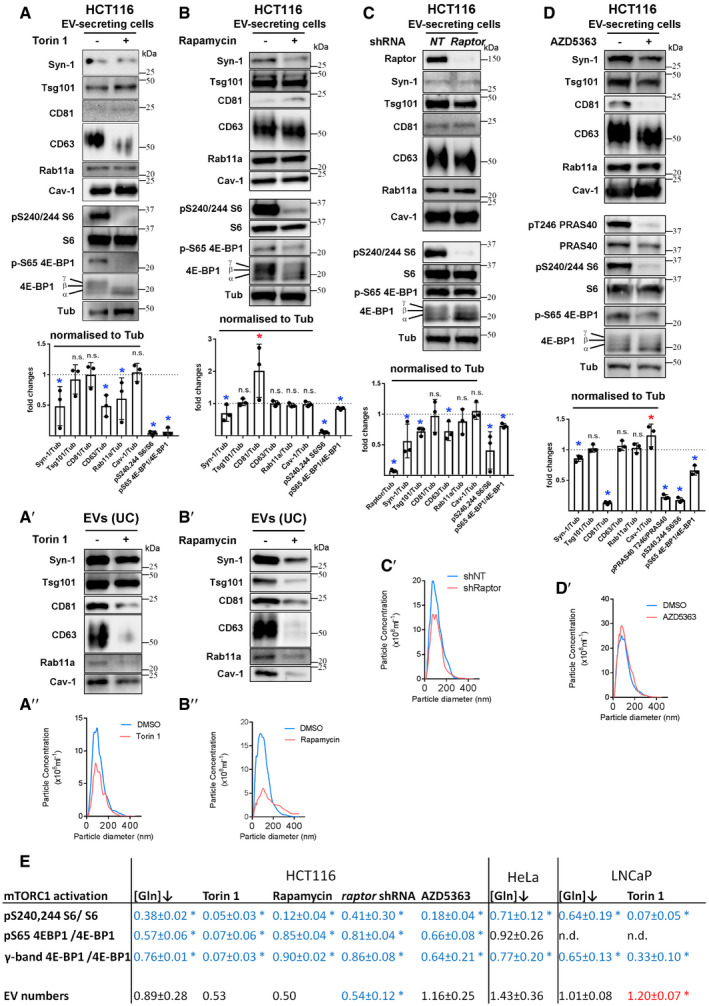
Figure EV4. Changes in EV proteins in cell lysates and EVs following reduction in PI3K/Akt/mTORC1 signalling in HCT116 cells.

Panels show Western blot analyses of cell and EV proteins, as well as Nanosight Tracking Analysis (NTA) of EV size and number.
- Western blot analysis of lysates from HCT116 cells cultured in the presence or absence of 100 nM Torin 1 for 24 h. Total protein levels were reduced by approximately 20% following drug treatment. Bar chart shows the abundance of putative exosome proteins relative to tubulin in these lysates and relative levels of phosphorylation of mTORC1 downstream readouts, S6 and 4E‐BP1 (measured as a ratio of p‐S65-4E‐BP1 to pan 4E‐BP1). Significantly decreased levels are in blue and increased levels are in red. (A′) Western blot analysis of EV preparations isolated by ultracentrifugation from HCT116 cells cultured in the presence or absence of 100 nM Torin 1 for 24 h. EV loading was normalised to protein level in cell lysates. (A″) NTA for EV samples produced as in (A′).
- Western blot analysis of lysates from HCT116 cells cultured in the presence or absence of 10 nM rapamycin for 24 h. Total protein levels were reduced by 7 ± 2% following drug treatment. Bar chart shows the abundance of putative exosome proteins relative to tubulin in these lysates and relative levels of phosphorylation of mTORC1 downstream readouts, S6 and 4E‐BP1 (measured as a ratio of p‐S65-4E‐BP1 to pan 4E‐BP1). Significantly decreased levels are in blue and increased levels are in red. (B′) Western blot analysis of EV preparations from HCT116 cells isolated by ultracentrifugation from HCT116 cells cultured in the presence or absence of 10 nM rapamycin for 24 h. EV loading was normalised to protein level in cell lysates. See Appendix Fig S7E for analysis of SEC‐isolated EVs under these conditions. (B″) NTA for EV samples produced as in (B′).
- With relevance to EVs shown in Fig 5D, Western blot analysis of lysates from HCT116 cells subjected to 4 days of raptor or non‐targeting (NT) shRNA knockdown. Total protein levels were not significantly altered by knockdown versus control. Bar chart shows the abundance of putative exosome proteins relative to tubulin in these lysates and relative levels of phosphorylation of mTORC1 downstream readouts, S6 and 4E‐BP1 (measured as a ratio of p‐S65-4E‐BP1 to pan 4E‐BP1). Significantly decreased levels are in blue and increased levels are in red. (C′) NTA for EV samples produced as in Fig 5D.
- With relevance to EVs shown in Fig 5E, Western blot analysis of lysates from HCT116 cells cultured in the presence or absence of 3 μM AZD5363 for 24 h. Total protein levels were reduced by 12 ± 5% following drug treatment. Note that phosphorylation of PRAS40, an Akt target, is reduced by drug treatment. Bar chart shows the abundance of putative exosome proteins relative to tubulin in these lysates and relative levels of phosphorylation of mTORC1 downstream readouts, S6 and 4E‐BP1 (measured as a ratio of p‐S65-4E‐BP1 to pan 4E‐BP1). Significantly decreased levels are in blue and increased levels are in red. (D′) NTA for EV samples produced as in Fig 5E.
- Table summarising relative EV secretion, and relative activity of mTORC1 assessed by analysing levels of 4E‐BP1 and S6 phosphorylation under conditions shown in panels A–D, in Fig 4A and in Appendix Fig S7. Note strong inhibition of S6 phosphorylation in Torin 1‐ and rapamycin‐treated HCT116 cells, which is associated with low levels of EV‐ and exosome‐associated proteins and low EV particle number counts by NTA. Data analysed by the Kruskal–Wallis test: *P < 0.05. Significantly decreased levels versus control are in blue and increased levels are in red.
