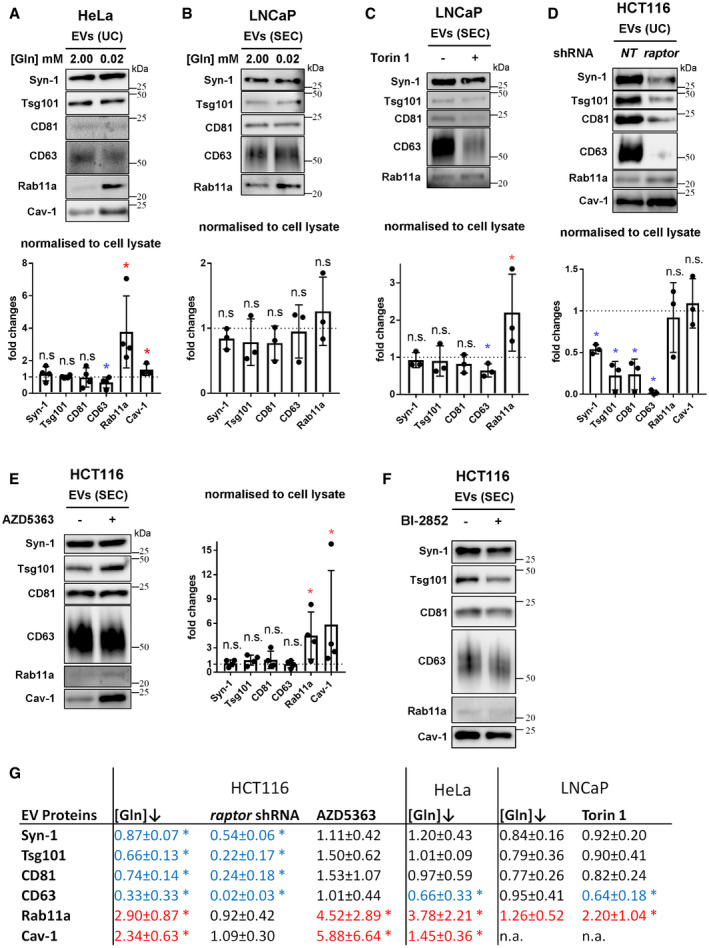
Western blot analyses of EV preparations. Gel loading is normalised to cell lysate protein levels. Bar charts present changes in levels of putative exosome proteins relative to cell lysate protein.
EVs isolated by UC of medium from HeLa cells cultured in glutamine‐replete (2.00 mM) and ‐depleted (0.02 mM) conditions for 24 h (see
Appendix Fig S7A″ for analysis of SEC‐isolated EVs).
EVs isolated by size‐exclusion chromatography (SEC; fractions two to seven) from LNCaP cells cultured in glutamine‐replete (2.00 mM) and ‐depleted (0.02 mM) conditions for 24 h.
EVs isolated by SEC from LNCaP cells cultured in the presence or absence of 120 nM Torin 1 for 24 h.
EVs isolated by UC from HCT116 cells cultured for 24 h following 3 days of raptor or non‐targeting (NT) shRNA knockdown.
EVs isolated by SEC from HCT116 cells cultured in the presence or absence of 3 μM Akt inhibitor AZD5363 for 24 h.
EVs isolated by SEC from HCT116 cells cultured under glutamine‐replete conditions in the presence or absence of 10 μM KRAS inhibitor BI‐2852 (or control compound Bl2853) for 24 h.
Table summarising the EV protein analyses in Figs
4 and
5 (normalised to cell lysate protein levels). Data analysed by the Kruskal–Wallis test: *
P < 0.05. Significantly decreased levels are in blue and increased levels are in red.
Data information: Bar charts derived from at least three independent experiments and analysed by the Kruskal–Wallis test: *
P < 0.05; n.s. = not significant. Bars and error bars denote mean ± SD. Significantly decreased levels are in blue and increased levels are in red.
Source data are available online for this figure.

