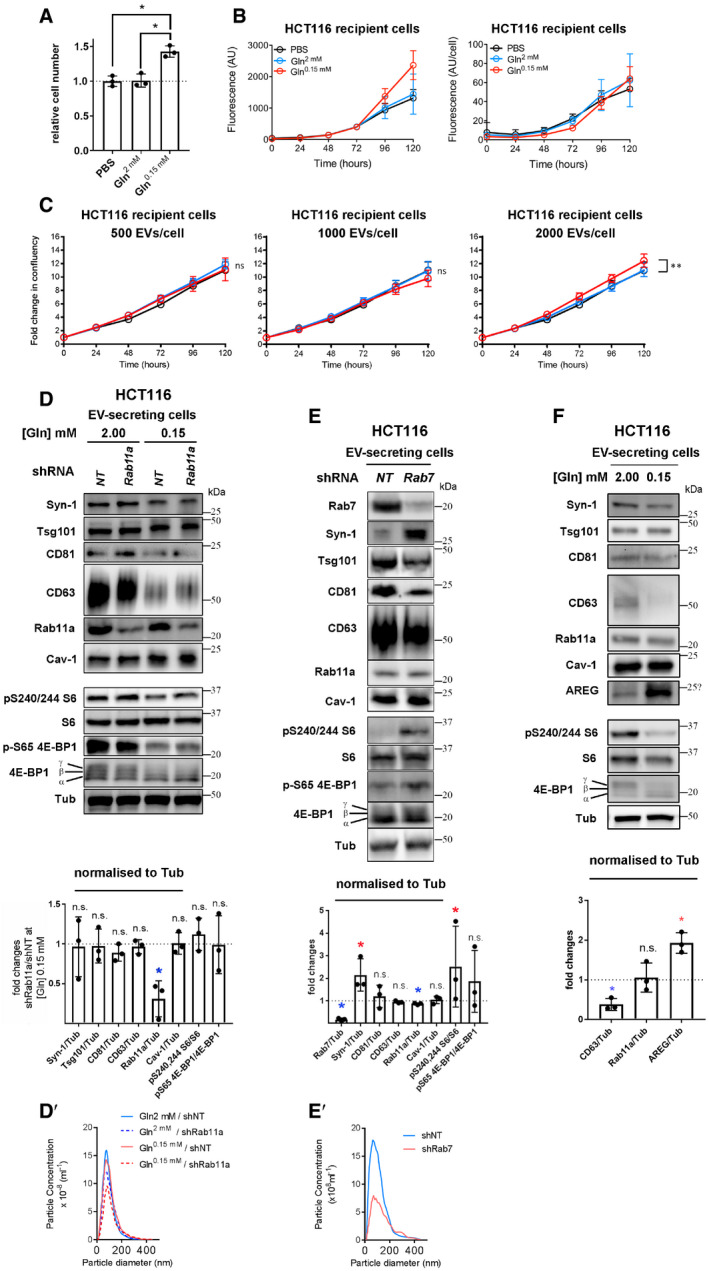
Western blot analysis of cell lysate proteins, and Nanosight Tracking Analysis (NTA) of EV size and number in D′ and E′. Bar charts indicate putative exosome protein levels normalised to Tubulin on Western blots. (D) With relevance to EVs shown in Fig
6C, Western blot analysis of lysates from EV‐secreting cells with and without knockdown of
Rab11a in glutamine‐replete and glutamine‐depleted conditions. Total protein levels were increased by 1 ± 3% following knockdown. Bar chart shows the abundance of putative exosome proteins relative to tubulin in these lysates and relative levels of phosphorylation of mTORC1 downstream readouts, S6 and 4E‐BP1 (measured as a ratio of p‐S65-4E‐BP1 to pan 4E‐BP1). Significantly decreased levels are in blue and increased levels are in red.(D′) NTA of EVs isolated from HCT116 cells with and without knockdown of
Rab11a. (E) With relevance to EVs shown in Fig
6F, Western blot analysis of proteins isolated from EV‐secreting HCT116 cells with and without knockdown of
Rab7. Bar chart shows the abundance of putative exosome proteins relative to tubulin in these lysates and relative levels of phosphorylation of mTORC1 downstream readouts, S6 and 4E‐BP1 (measured as a ratio of p‐S65-4E‐BP1 to pan 4E‐BP1). Significantly decreased levels are in blue and increased levels are in red. (E′) NTA of EVs isolated from HCT116 cells with and without knockdown of
Rab7. (F) With relevance to EVs shown in Fig
7C, Western blot analysis of cell lysates from HCT116 cells cultured in glutamine‐replete (2.00 mM) and glutamine‐depleted (0.15 mM) medium for 24 h. Gel was loaded with equal protein amounts. The activity of mTORC1 was assessed via phosphorylation of S6 and 4E‐BP1. Bar chart shows the abundance of selected exosome/EV proteins relative to tubulin in these lysates. Significantly decreased levels are in blue and increased levels are in red.

