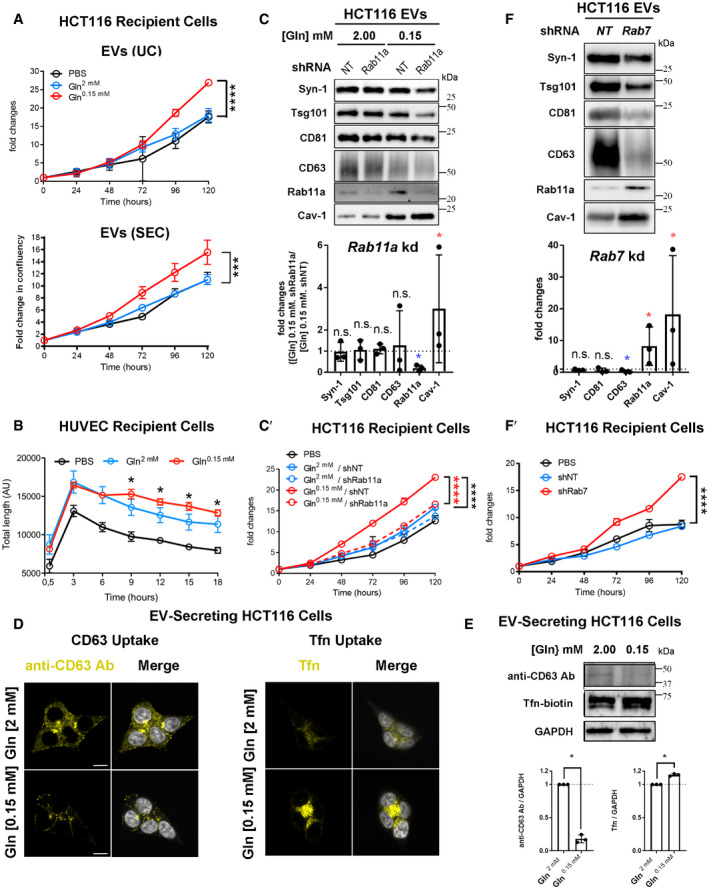
Growth curves for HCT116 recipient cells in reduced (1%) serum conditions following 30‐min pre‐incubation with EVs isolated by UC (104 per cell; top) or by SEC (4 × 10³ per cell; bottom) from glutamine‐replete and glutamine‐depleted HCT116 cells or with vehicle (PBS). Fold change in confluency is a measure of cell area occupying well relative to zero time, as measured by IncuCyte software.
Cumulative tube length for HUVEC recipient cells following treatment with 104 EVs isolated by UC from glutamine‐replete and glutamine‐depleted HCT116 cells or with vehicle (PBS). Both EV preparations promote tubulation, but the network is more stable with EVs from glutamine‐depleted HCT116 cells.
Western blot analysis of EVs isolated by UC from HCT116 cells cultured in glutamine‐replete and glutamine‐depleted medium for 24 h, following transduction with a Rab11a or control non‐targeting (NT) shRNA knockdown construct over previous 2 days. Bar chart shows change in putative exosome proteins in EVs secreted from Rab11a knockdown cells relative to NT‐treated cells in glutamine‐depleted conditions, following initial normalisation to cell lysate protein. (C′) Growth curves are for HCT116 recipient cells pre‐treated with EVs isolated as in (C) or with vehicle (PBS). ****P colour denotes significant increase relative to EVs from glutamine‐replete cells (black) and Rab11a knockdown cells (red).
Left‐hand group of four images shows cells grown in glutamine‐replete (2.00 mM) and glutamine‐depleted (0.15 mM) conditions for 24 h, then incubated with an anti‐CD63 antibody (yellow) for 30 min at 4°C, washed with PBS, chased at 37°C for 30 min, then fixed, immunostained and imaged. Right‐hand group of four images shows cells grown in glutamine‐replete and glutamine‐depleted conditions for 24 h, incubated with Tfn‐Alexa Fluor® 488 (yellow) for 30 min at 4°C, shifted to 37°C for 30 min, then washed, immediately fixed and imaged.
Western blot showing levels of anti‐CD63 heavy‐chain and biotin‐conjugated Tfn in HCT116 cells cultured for 24 h in glutamine‐replete or glutamine‐depleted conditions, incubated for 30 min in medium containing these molecules at 4°C, then chased at 37°C for 15 min (the chase step was not performed for Tfn in D, to reduce loss due to rapid recycling of Tfn).
Western blot analysis of EVs isolated by UC from HCT116 cells in glutamine‐replete medium, transduced with a Rab7 or non‐targeting (NT) control shRNA knockdown construct. Bar charts show changes in putative exosome proteins in EVs isolated by ultracentrifugation, following normalisation to cell lysate protein. (F′) Growth curves are for HCT116 recipient cells pre‐treated with EVs isolated as in (F) or with vehicle (PBS).
Data information: Scale bars in D (5 μm) apply to all panels. Growth curves were reproduced in three independent experiments and analysed by two‐way ANOVA. Bar charts derived from three independent experiments and analysed by the Kruskal–Wallis test: ****
< 0.05. Bars and error bars denote mean ± SD. Significantly decreased levels are in blue and increased levels are in red in panels C and F.

