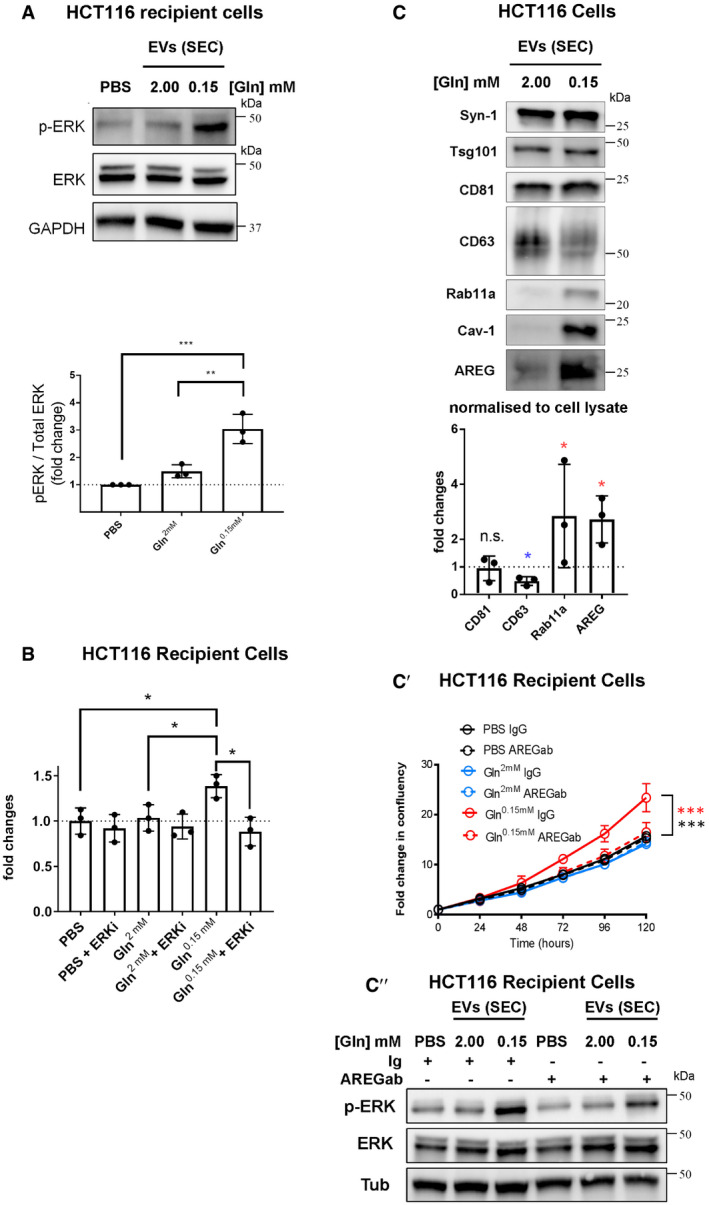
Western blot analysis showing levels of the EGFR ligand, amphiregulin (AREG) in EVs isolated by SEC of medium from HCT116 cells cultured in glutamine‐replete (2.00 mM) or glutamine‐depleted (0.15 mM) conditions for 24 h. Gel loading was normalised to cell lysate protein levels. AREG's molecular weight (approximately 26–28 kDa) suggests it is in its membrane‐associated form (see
Appendix Fig S8D). In the bar chart, the levels of putative exosome proteins were normalised to cell lysate protein levels. Significantly decreased levels are in blue and increased levels are in red. (C′) Growth curves in low (1%) serum are for HCT116 recipient cells pre‐treated with the EV preparations [isolated as in (C)], which had themselves been pre‐treated with and without anti‐AREG neutralising antibody or with a control IgG. Solid red line shows growth‐promoting effect of EVs isolated under glutamine depletion, which is blocked by anti‐AREG antibody (red dashed line). ***
P colour denotes significant increase relative to EVs from glutamine‐replete cells (black) and after anti‐AREG treatment of EVs (red). (C″) Western blot analysis of ERK phosphorylation (p‐ERK) in recipient serum‐deprived HCT116 cells pre‐treated with EVs isolated by SEC from glutamine‐replete (2.00 mM) or glutamine‐depleted (0.15 mM) HCT116 cells or vehicle (PBS), which were pre‐treated with anti‐AREG (AREGab) or a control immunoglobulin (Ig). Note increase in ERK phosphorylation using EVs from glutamine‐depleted cells, which is blunted by the addition of the anti‐AREG antibody.

