
FIGURE 5.
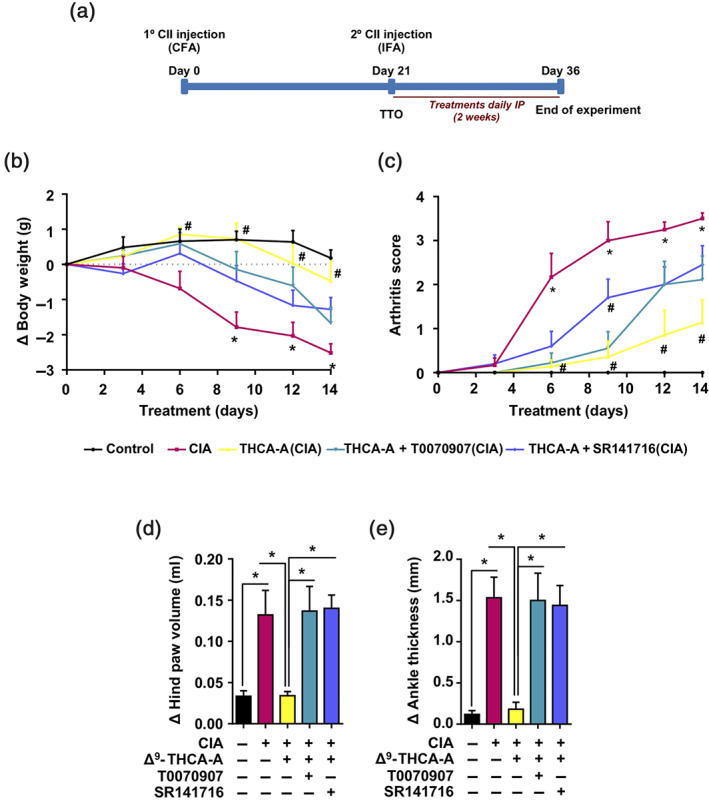
Effect of administration of Δ9‐THCA‐A in a model of collagen‐induced arthritis. (a) Timeline of treatment experiments in the CIA model. (b) Cumulative body weight change and (c) clinical scores in control mice, CIA‐induced mice, and treated mice during the treatment; values are referenced at the beginning of treatment (taken as 0). Measurement of paw swelling using a (d) plethysmometer and (e) callipers at the end of the 2‐week treatment period. Data are means ± SEM; n = 9 mice per group. In (b, c), * P < .05, significantly differences between CIA mice and control mice; # P < 0.05, significantly differences between vehicle‐ or Δ9‐THCA‐A + SR141716‐treated CIA mice and Δ9‐THCA‐A‐treated CIA mice. For (d, e), * P < .05, significantly different as indicated