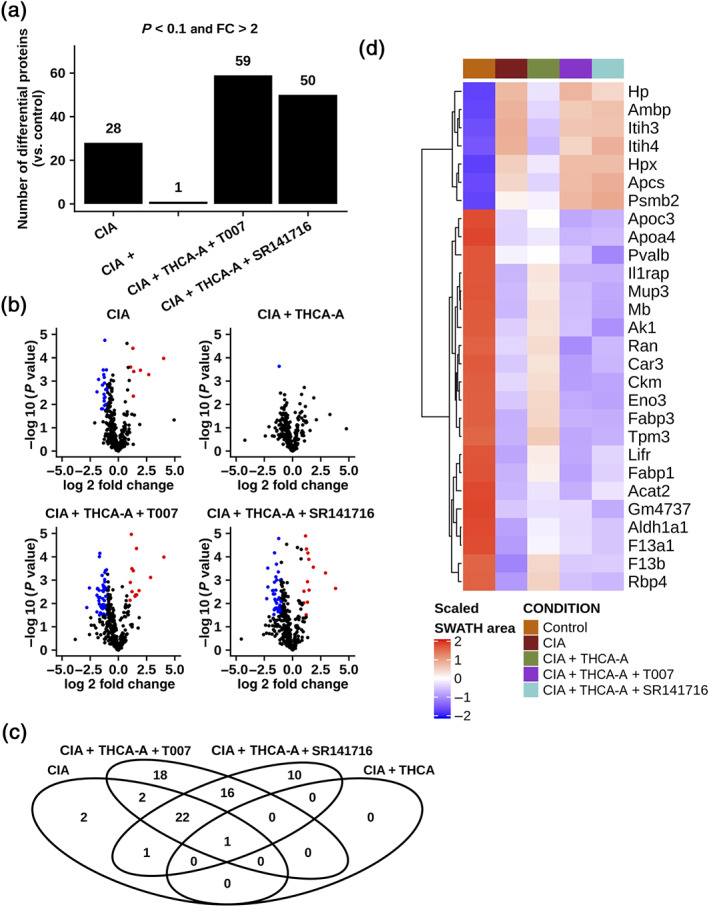
FIGURE 9.

Proteomic analysis of Δ9‐THCA‐A effects in plasma of CIA mice. (a) Bar plot reflecting the number of proteins that surpass the cut‐off of an adjusted P value <0.1 and an absolute fold change >2 in every comparison. (b) Volcano plots showing the magnitude and significance of the changes by comparison. Each point represents a protein, and the colour indicates whether it is up‐regulated (red) or down‐regulated (blue), using the previously mentioned cut‐off. (c) Venn diagram indicating the overlap between the groups of altered proteins. The red box highlights the 22 common for CIA, CIA + THCA + T0070907, and CIA + THCA + SR141716. (d) Heatmap depicting the abundance of the 28 significantly altered proteins in the CIA versus control comparison. The colour reflects the scaled normalized SWATH areas mean by group. Representative data from six mice per group are shown
