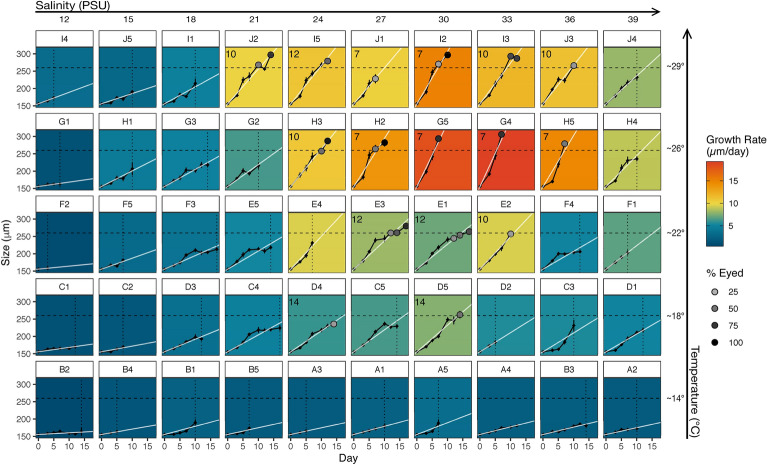
Figure 4.
Growth of oyster larvae in 50 environmental treatments arranged by target salinity (left–right) and target temperature (bottom-top). Black lines are lengths of larval shells (n = 3–44), white lines are linear regressions, showing average growth/day. Horizontal dotted lines mark our size classification for late-stage larvae (260 µm). Filled in circles represent proportion of sampled larvae with visible eyespots at all samples > 25%. Vertical dotted lines indicate > 95% mortality. Panel color represents growth rate (µm/day). Numbers denote the day that treatments became competent (first sampling of > 25% eyed larvae).

