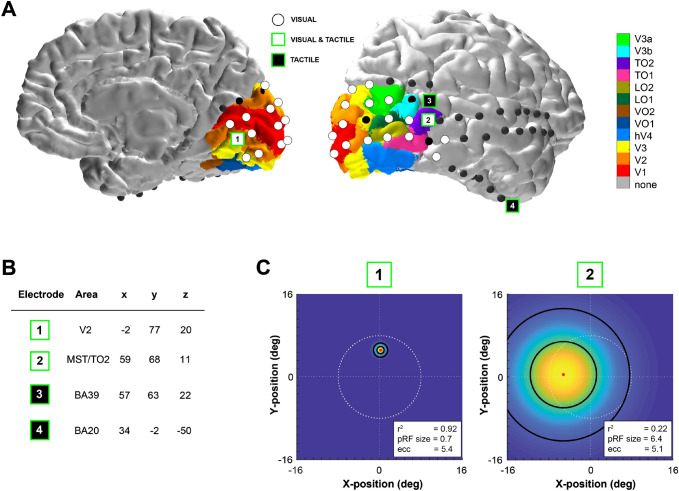
Fig. 2.
Spatial localization of significant high frequency band responses to tactile stimulation. a Electrodes exhibiting significant high frequency band responses to visual stimulation in either the contralateral or ipsilateral hemifield are shown in white on the participant’s brain rendering. Four electrodes (marked as 1 to 4) showed a significant change in high frequency band power during tactile stimulation. Electrodes responding to the tactile task and located in visually responsive sites are shown in white and green (electrode 1 and 2), while electrodes significantly responding to only the tactile task and not showing visual responses are displayed in black and green (electrodes 3 and 4). Colour maps indicate estimates of early and extrastriate visual areas based on the participant’s surface topology and a prior, learned retinotopic atlas (Benson et al. 2012; Benson and Winawer 2018). b Electrode coordinates in MNI space. c Estimated population receptive fields (pRFs) for electrodes 1 and 2 depicted in the visual field. White dashed lines indicate the central fixation (straight lines) and the extent of the visual field that was covered by the visual stimulus (16.6° diameter of visual angle, circle). The color scale indicates the height of the pRF, i.e. the best-fitting 2D isotropic Gaussian (yellow is high, blue is low), with the pRF center location indicated by the red dot, and black outlines depicting 1 and 2 pRF sizes. Corresponding pRF size and eccentricity parameters are presented in the lower right corner

