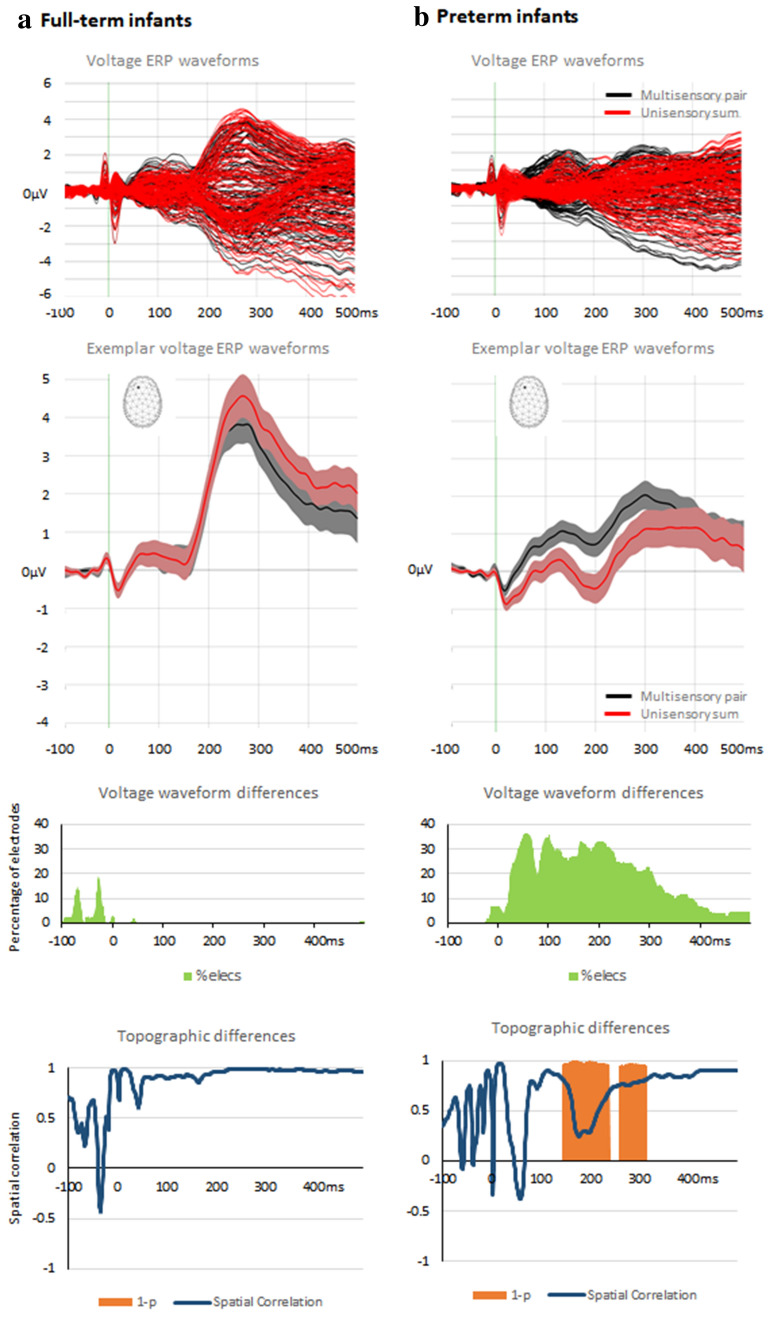
Fig. 2.
ERP analyses contrasting multisensory and summed unisensory responses from full term and preterm infants (panels a and b, respectively). The uppermost row displays group-averaged data from all electrodes for the multisensory pair and summed unisensory conditions. The next row displays group-averaged data (s.e.m. indicated by shaded area) from an exemplar fronto-central electrode (see inset). The next row displays the percentage of the electrode montage exhibiting a significant difference as a function of time. The bottom row displays the spatial correlation between multisensory and summed unisensory responses (blue line) as well as time periods of significant differences (orange areas)

