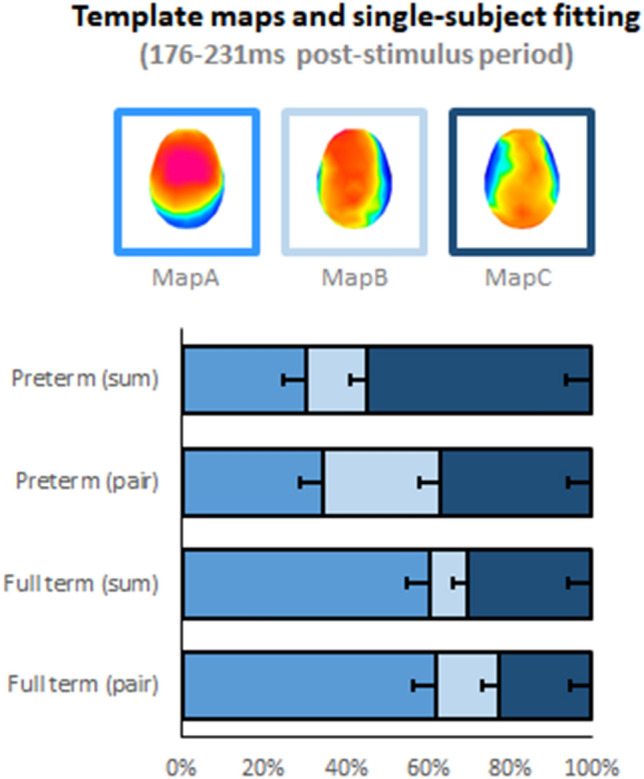
Fig. 3.

Template maps identified over the 176–231 ms post-stimulus period via unsupervised hierarchical clustering of the ERP topography using the group-averaged dataset concatenated across conditions and full-term and preterm infants. The maps are displayed with the nose upwards and left hemiscalp on the left. The bar graphs display the single-subject fitting based on the spatial correlation between the template maps shown the top row and each time point of the infant’s data over the 176–231 ms post-stimulus period. The bars show the average percentage of time each template map yielded the highest spatial correlation (error bars indicate s.e.m.)
